Introduction
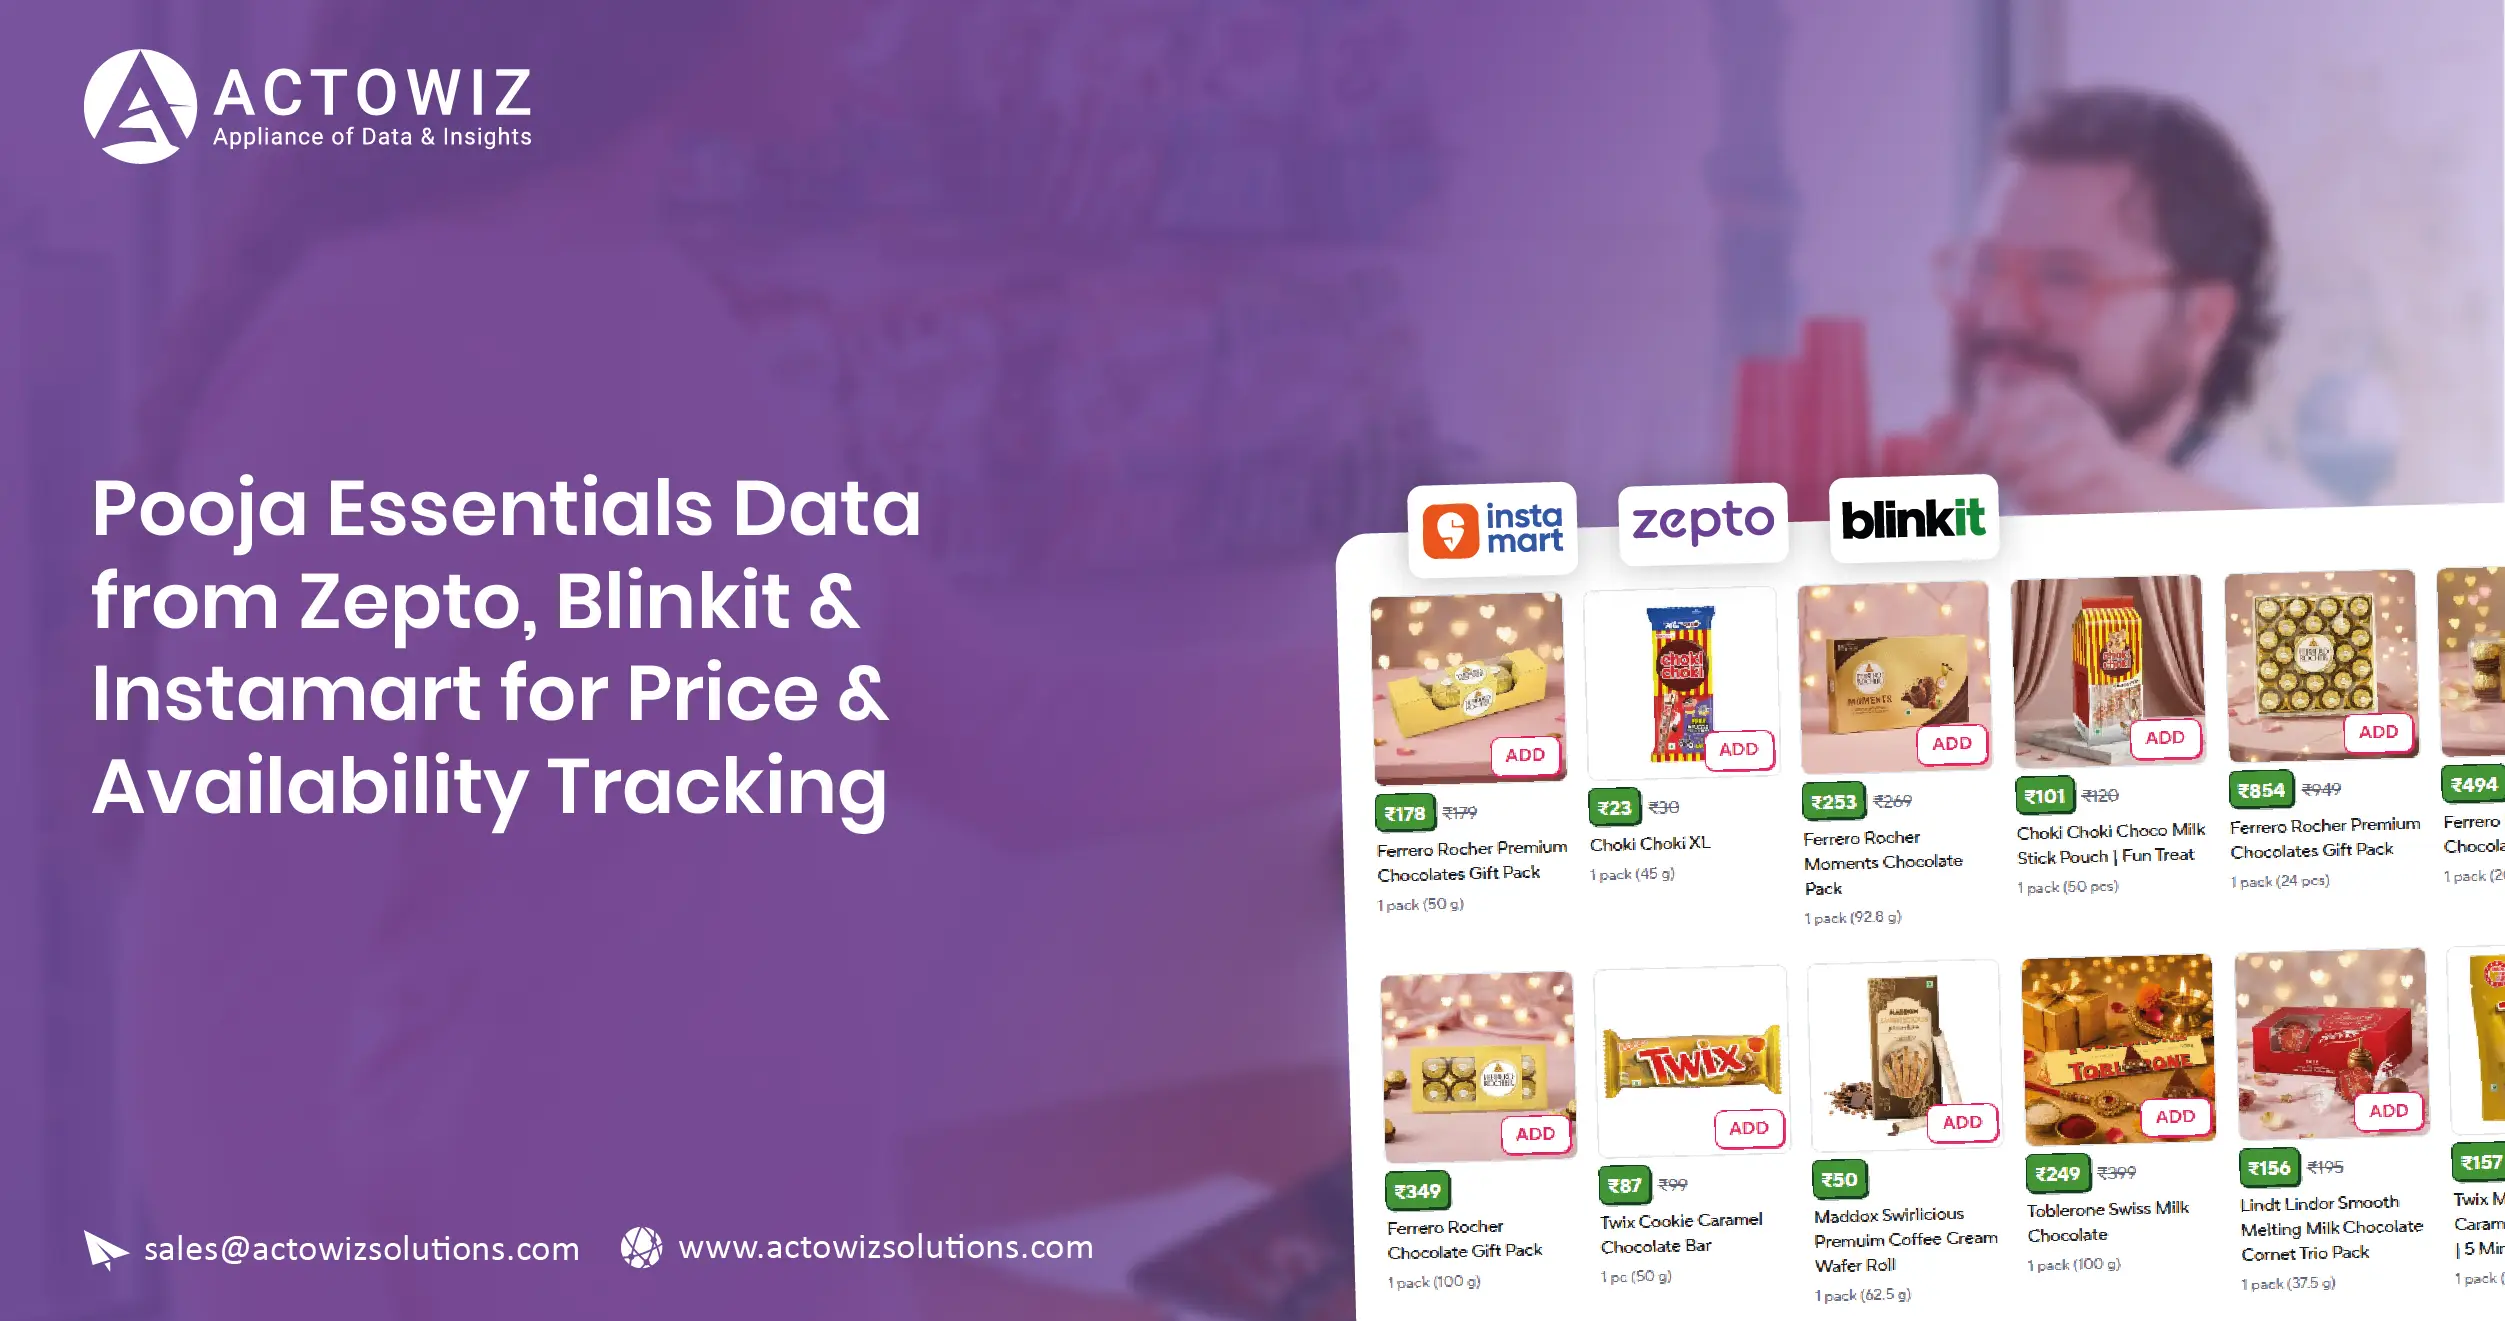
Pooja Essentials Data Extraction Form Zepto, Blinkit & Instamart helps brands, retailers, distributors, and market intelligence teams monitor fast-changing product prices, availability, assortment, and competitive activity across India's leading quick-commerce platforms.
The core answer is simple: automated collection converts frequently changing marketplace information into structured, time-stamped datasets that businesses can compare over time. This is particularly relevant for pooja essentials because demand can change sharply around festivals, religious occasions, weekends, regional events, and promotional periods.
India's quick-commerce channel has expanded rapidly. RedSeer reported that India's quick-commerce GMV exceeded $10 billion in 2025, with more than 30 million monthly transacting users and approximately 80% of GMV coming from metros. (Redseer Strategy Consultants) A 2026 RedSeer report estimates quick-commerce GMV at $11.5 billion in 2025 and projects $25 billion for 2026. (Redseer Strategy Consultants)
India Quick-Commerce Growth Indicators
| India quick-commerce indicator |
Reported figure |
Period |
| Quick-commerce GMV |
$1.5B |
2022 |
| Quick-commerce GMV |
$2.6B |
2023 |
| Quick-commerce GMV |
$5.0B |
2024 |
| Quick-commerce GMV |
$11.5B estimated |
2025 |
| Quick-commerce GMV |
$25B projected |
2026 |
| Monthly transacting users |
50M+ estimated |
2026 |
| Cities |
250+ estimated |
2026 |
Source: RedSeer, 2026. (Redseer Strategy Consultants)
Analysis: The rapid expansion means quick-commerce platforms are no longer limited to emergency grocery purchases. Their assortment is expanding into categories such as beauty, home products, gifting, general merchandise, and other non-grocery products. RedSeer notes that category diversification is one of the drivers of quick-commerce growth. (Redseer Strategy Consultants)
For businesses selling incense sticks, camphor, diyas, cotton wicks, pooja kits, kumkum, agarbatti, ghee, oils, and related products, this creates a need for granular product-level monitoring.
Quick Commerce Data Scraping Services can support this requirement by collecting permitted, publicly accessible product information, normalizing records, detecting changes, and delivering structured datasets for analysis.
Why Is Quick-Commerce Data Important for Pooja Product Businesses?
Pooja essentials are highly assortment-sensitive. A retailer may offer a basic diya pack throughout the year but expand its range before Diwali. Another seller may introduce festival-specific kits, premium incense products, decorative diyas, or bundled offerings.
A static product catalog cannot adequately capture these changes.
A recurring data workflow can monitor:
- Product names
- Brands
- SKUs
- Pack sizes
- Prices
- MRP
- Discounts
- Availability
- Product categories
- Ratings and reviews where available
- Seller information
- Product URLs
- Collection timestamps
The objective is not simply to create a larger database. It is to establish a historical record of what was available, at what price, and when.
How Can Brands Track Pooja Products Across Major Platforms?
Zepto, Blinkit & Instamart pooja product data scraping can help businesses compare product-level information across multiple quick-commerce platforms. When combined with Pooja Essentials Data Extraction Form Zepto, Blinkit & Instamart, the resulting dataset can support cross-platform assortment, pricing, and availability analysis.
The first challenge is product matching. The same product may appear as:
- "Brass Diya"
- "Brass Oil Lamp"
- "Traditional Brass Diya"
- "Pooja Brass Diya"
These descriptions may refer to the same or similar products but cannot be reliably compared using simple text matching.
A structured pipeline can normalize:
| Data dimension |
Normalization requirement |
| Product name |
Standard product naming |
| Brand |
Consistent brand entity |
| Pack size |
Common unit format |
| Category |
Standard category taxonomy |
| Price |
Numeric currency value |
| MRP |
Separate from selling price |
| Availability |
Standard stock status |
| SKU |
Platform/product identifier |
| Timestamp |
Exact collection date/time |
What does the 2020–2026 growth trajectory tell us?
Quick commerce has moved from an emerging delivery model to a major retail channel. RedSeer reported that monthly transacting users increased by more than 40% in FY24, while monthly ordering frequency reached nearly six orders per user, compared with 4.4 in FY21. (Redseer Strategy Consultants)
Bain and Flipkart reported that quick commerce accounted for more than two-thirds of India's online grocery orders in 2024 and approximately one-tenth of e-retail spending. The channel's gross merchandise value was reported at $7 billion in 2024, compared with $1.6 billion in 2022. (Moneycontrol)
Analysis: Higher ordering frequency means consumers have more opportunities to discover products through quick-commerce interfaces. For pooja brands, this makes product visibility, assortment, pricing, and availability increasingly measurable digital variables.
A business can use recurring observations to determine whether a product appears across all three platforms, only one platform, or disappears temporarily from a particular location.
How Can Businesses Monitor Prices and Availability More Precisely?
Pooja essentials pricing & availability data India gives brands a way to analyze the commercial variables that change most frequently on quick-commerce platforms.
Price monitoring should distinguish between MRP, listed price, discount, and final payable price whenever the source makes those fields available. Treating these values as the same can produce misleading competitive comparisons.
For example, a business could calculate:
Discount percentage = (MRP − selling price) ÷ MRP × 100
It could then compare price movements by SKU, brand, platform, category, and location.
What does the broader market data show?
| Indicator |
Real-world result |
| Quick-commerce GOV in 2024 |
$7B |
| Quick-commerce GOV in 2022 |
$1.6B |
| Share of online grocery orders in 2024 |
More than two-thirds |
| Share of e-retail spending in 2024 |
About one-tenth |
| FY24 monthly ordering frequency |
Nearly 6 orders/user |
| FY21 monthly ordering frequency |
4.4 orders/user |
Sources: Bain/Flipkart and RedSeer. (Moneycontrol)
Analysis: The increase from $1.6 billion in 2022 to $7 billion in 2024 demonstrates how quickly the channel expanded. More transactions also create more opportunities for price and assortment changes.
For pooja product sellers, the practical implication is that a quarterly or one-time competitive snapshot may miss meaningful changes around high-demand periods.
A recurring workflow can identify:
- Price increases
- Price reductions
- New discounts
- Products going out of stock
- Products returning to stock
- New SKUs
- Removed SKUs
- Pack-size changes
- Platform-specific assortment differences
Businesses can then compare current observations against historical records rather than relying on memory or manually maintained spreadsheets.
How Can SKU-Level Tracking Reveal Product and Stock Changes?
Pooja SKU pricing & stock data Form Zepto can provide a SKU-level view of individual products and their commercial status.
SKU tracking is important because category-level information can hide important differences. For example, a business may find that "diyas" are available on a platform while a specific 12-piece brass diya SKU is unavailable.
A SKU-level dataset can capture:
| Attribute |
Analytical purpose |
| SKU/product ID |
Record identification |
| Product name |
Product matching |
| Brand |
Brand comparison |
| Pack size |
Value comparison |
| MRP |
Reference price |
| Selling price |
Current price |
| Discount |
Promotion analysis |
| Stock status |
Availability |
| Category |
Assortment analysis |
| Location |
Localized visibility |
| Timestamp |
Historical tracking |
What changed between 2020 and 2026?
RedSeer reported that India's quick-commerce market was approximately $2.8 billion in 2024 and described the channel as increasingly important for product discovery and category expansion. (Redseer Strategy Consultants)
By 2025, RedSeer reported more than $10 billion in GMV and 30 million-plus monthly users. (Redseer Strategy Consultants) Its 2026 projections place GMV at approximately $25 billion. (Redseer Strategy Consultants)
Analysis: The expansion of the channel means SKU-level monitoring has become more relevant for brands seeking to understand how products are presented and sold digitally. However, market-wide quick-commerce growth should not be interpreted as proof that every pooja SKU is growing at the same rate.
Instead, businesses should measure actual product-level changes.
A useful monitoring dashboard could report:
- Number of active SKUs
- Number of new SKUs
- Number of discontinued or unavailable SKUs
- Average price by category
- Median price by category
- Discount frequency
- Stock-out frequency
- Platform coverage
- Brand coverage
This creates an evidence-based view of assortment and availability.
How Can Assortment Monitoring Improve Festival and Seasonal Planning?
Blinkit Pooja Essentials assortment data Collection can help brands understand how product availability changes by platform and, where data permits, by location.
Pooja products are particularly suitable for time-series assortment monitoring because demand can be seasonal. Product ranges may expand before major festivals and contract afterward.
A recurring dataset can reveal:
- Which products appear before festivals
- Which products remain year-round
- Which brands expand assortment
- Which pack sizes become more prominent
- Which products disappear after peak periods
- Whether premium or bundled products are introduced
- How quickly competitors react to demand
How large is the quick-commerce ecosystem?
A 2025 Quick-Commerce Playbook from MMA Global India and Publicis Commerce reported that Blinkit, Zepto, and Instamart together represented more than 85% of daily order volume, and identified more than 4,000 dark stores and presence across more than 70 cities for the quick-commerce ecosystem discussed in the report. The report's cited order-share chart showed Blinkit at 35%, Zepto at 31%, and Instamart at 22%. (MMA / Marketing + Media Alliance)
| Platform |
Reported order share in 2025 playbook |
| Blinkit |
35% |
| Zepto |
31% |
| Instamart |
22% |
| Bigbasket |
9% |
| Flipkart Minutes |
3% |
Source: MMA Global India/Publicis Commerce Quick-Commerce Playbook 2025. (MMA / Marketing + Media Alliance)
Analysis: These figures are channel-level order shares, not pooja-category shares. They should therefore not be used to conclude that one platform has a specific share of pooja product sales.
Their value for data strategy is different: the three platforms represent a substantial portion of the quick-commerce ecosystem, making cross-platform monitoring useful for brands whose products are sold through these channels.
For seasonal planning, businesses can compare historical snapshots before, during, and after major occasions to identify assortment expansion and contraction.
How Can Platform-Specific Price Intelligence Support Better Decisions?
Instamart pooja product Pricing Data intelligence can help businesses compare pricing patterns, promotional activity, assortment depth, and availability across individual platform environments.
Platform-specific analysis matters because the same brand can have different:
- Selling prices
- Discounts
- Pack sizes
- Product titles
- Bundles
- Availability
- Assortment depth
- Promotional visibility
A cross-platform dataset can therefore answer more precise questions.
What can businesses calculate?
| Metric |
Calculation/use |
| Average selling price |
Mean observed selling price |
| Median selling price |
Central price benchmark |
| Discount rate |
Discounted listings ÷ total listings |
| Availability rate |
Available listings ÷ tracked listings |
| Platform coverage |
Platforms carrying a SKU |
| Assortment depth |
Number of active SKUs |
| Price gap |
Difference between platform prices |
| New SKU rate |
New listings during a period |
These are calculated metrics based on collected product observations, rather than fixed industry benchmarks.
What does 2025–2026 market data show?
RedSeer estimated that quick commerce represented around 15% of India's e-commerce GMV in 2025 and reported more than 30 million monthly transacting users. (Redseer Strategy Consultants)
Its 2026 research projects quick-commerce GMV at approximately $25 billion, with more than 50 million monthly transacting users and 250+ cities. (Redseer Strategy Consultants)
Bain's 2026 assessment reported that India's overall e-retail market reached approximately $65–66 billion in 2025, with quick commerce accounting for roughly 16–17% of e-commerce GMV. (Business Standard)
Analysis: The increasing economic importance of quick commerce makes platform-level pricing intelligence more relevant. Yet the numbers are market-level indicators. They do not replace SKU-level evidence.
For pooja brands, that distinction is critical. A category can grow while an individual product loses visibility, becomes unavailable, or faces increased competition.
How Can Automated Collection Build a Reliable Cross-Platform Intelligence Layer?
Zepto Data Scraping can provide the collection layer for businesses that need structured product observations from permitted sources. Pooja Essentials Data Extraction Form Zepto, Blinkit & Instamart can then be organized into a unified schema for comparison across platforms.
The complete workflow can include six stages.
- Source discovery – Identify the relevant product categories, pages, locations, and permitted sources.
- Product extraction – Collect product names, brands, SKUs, pack sizes, prices, discounts, availability, and other required attributes.
- Normalization – Convert inconsistent product titles, units, brands, and category names into standardized values.
- Entity matching – Determine whether listings across platforms represent the same product or different variants.
- Historical monitoring – Store dated observations so businesses can identify changes instead of viewing only the latest state.
- Analytics delivery – Provide structured datasets suitable for dashboards, BI tools, databases, APIs, or internal analytics systems.
What does the 2020–2026 trend mean for data teams?
The channel's growth is substantial. RedSeer estimates show GMV increasing from $1.5 billion in 2022 to $5 billion in 2024 and an estimated $11.5 billion in 2025, with a projection of $25 billion in 2026. (Redseer Strategy Consultants)
This growth creates more digital shelf information to monitor.
However, automated collection should not mean indiscriminate collection. A responsible workflow should define:
- Permitted sources
- Required fields
- Collection frequency
- Data retention rules
- Validation procedures
- Deduplication rules
- Access controls
- Applicable terms and legal requirements
The objective is a dependable intelligence pipeline rather than a high-volume scraping exercise.
What Should a Pooja Essentials Monitoring Dataset Contain?
A strong dataset should reflect the business questions being asked.
Product attributes
- Product name
- Brand
- Category
- Subcategory
- SKU
- Pack size
- Unit
- Product description
Commercial attributes
- MRP
- Selling price
- Discount
- Promotional price
- Availability
- Seller/platform
Competitive attributes
- Platform
- Competitor brand
- Product URL
- Platform-specific assortment
- First-seen date
- Last-seen date
Geographic attributes
Where the source makes location-specific information available:
- City
- Service area
- Store/dark-store location
- PIN code
- Regional availability
This enables businesses to distinguish national assortment from localized assortment.
What Real-World Results Can Businesses Derive From the Data?
The real value comes from comparing repeated observations.
Suppose a brand collects daily product observations. It can derive:
- Availability Rate: Available observations ÷ total observations × 100
- Average Price Change: Current average price − previous-period average price
- Platform Coverage: Number of platforms carrying a SKU
- Assortment Growth: New active SKUs − removed SKUs
- Promotion Frequency: Number of discounted observations ÷ total observations
These formulas do not represent industry benchmarks. They are practical analytical methods businesses can apply to their own collected datasets.
For example, a brand could discover that a particular pooja kit:
- Appears on two platforms but not the third.
- Has a lower observed price on one platform.
- Becomes unavailable several days before a festival.
- Receives a new competitor SKU during the same period.
- Gains additional pack-size variants during seasonal demand.
Such observations are more actionable than simply knowing that India's quick-commerce market is growing.
How Can Actowiz Solutions Help?
Actowiz Solutions can create a structured collection and monitoring workflow based on the client's product categories, platforms, geographic requirements, fields, and refresh frequency.
Blinkit Data Scraping, Pooja Essentials Data Extraction Form Zepto, Blinkit & Instamart can be structured around product discovery, SKU-level monitoring, price comparison, availability tracking, assortment analysis, and historical data delivery.
A typical solution can include:
- Product catalog extraction
- SKU-level data collection
- Brand identification
- Category classification
- Price and MRP capture
- Discount monitoring
- Availability tracking
- Pack-size normalization
- Cross-platform product matching
- Historical snapshots
- Duplicate detection
- Data validation
- Location-level monitoring where available
- Scheduled data collection
- Structured file or API delivery
The solution can be particularly useful for:
- Pooja product manufacturers: Track digital assortment and competitor positioning.
- Retailers: Benchmark prices and identify assortment gaps.
- Distributors: Monitor product visibility and platform availability.
- D2C brands: Understand how products appear across multiple quick-commerce channels.
- Market intelligence teams: Build recurring category-level datasets for research and analytics.
Which Technology Options Can Support the Workflow?
Web scraping API
A Web scraping API can allow businesses to connect structured collection outputs with internal databases, dashboards, applications, and analytics workflows.
Custom Datasets
Custom Datasets can be structured around selected pooja categories, brands, SKUs, cities, platforms, or competitive requirements.
instant data scraper
An instant data scraper can support targeted extraction requirements when a business needs a defined set of product information quickly, subject to source accessibility and applicable terms.
The technology should always follow the business requirement. A brand monitoring 500 SKUs daily needs a different architecture from a research team conducting a one-time category study.
What Should Businesses Monitor Before Festival Peaks?
A practical seasonal monitoring framework can begin several weeks before a major occasion.
Pre-season
Track:
- New product introductions
- New brands
- New pack sizes
- Initial pricing
- Baseline availability
Peak preparation
Monitor:
- Price changes
- Promotions
- Stock levels
- Assortment expansion
- Competitor additions
Peak period
Measure:
- Availability changes
- Price volatility
- Product visibility
- SKU coverage
- Platform differences
Post-season
Analyze:
- Products removed
- Remaining inventory signals
- Price normalization
- Persistent SKUs
- New recurring products
This creates a historical reference for future seasonal planning.
Conclusion
Pooja Essentials Data Extraction Form Zepto, Blinkit & Instamart can help brands, retailers, distributors, and market research teams transform fragmented quick-commerce listings into structured intelligence for price, availability, and assortment monitoring.
The underlying market is substantial and expanding. RedSeer estimates India's quick-commerce GMV at $11.5 billion in 2025, with a projection of $25 billion in 2026. (Redseer Strategy Consultants) Bain and Flipkart reported that quick commerce already accounted for more than two-thirds of online grocery orders in 2024. (Moneycontrol)
These market-level numbers establish the importance of the channel, but the most actionable insights come from product-level observations. Businesses need to know which pooja products are listed, what they cost, whether they are available, how assortment changes by platform, and how those variables evolve over time.
A structured automated workflow can provide this visibility while reducing repetitive manual research. By combining product extraction, SKU matching, normalization, validation, historical tracking, and analytics, businesses can build a more reliable digital shelf intelligence system.
Ready to track pooja essentials across India's leading quick-commerce platforms? Contact Actowiz Solutions to build a customized product, price, availability, and assortment monitoring solution!
You can also reach us for all your mobile app scraping, data collection, web scraping , and instant data scraper service requirements!

 By industry🏷 By platform🌐 By market
 Pricing & Promotions
MAP Violations Brand Protection Counterfeit Detection Price Intelligence AI HOT Data Intelligence
Pricing & Promotions
MAP Violations Brand Protection Counterfeit Detection Price Intelligence AI HOT Data Intelligence Brand & Intelligence
Share of Search Content Audit & PDP Reviews & Ratings Retail Media Buy Box Monitoring Social Commerce HOT Live Commerce NEW Agentic Commerce NEW
Brand & Intelligence
Share of Search Content Audit & PDP Reviews & Ratings Retail Media Buy Box Monitoring Social Commerce HOT Live Commerce NEW Agentic Commerce NEW Digital Shelf & Search
Assortment Planning Competitive Benchmarking Product Availability Q-Commerce NEW
Digital Shelf & Search
Assortment Planning Competitive Benchmarking Product Availability Q-Commerce NEW AssortmentE-commerce Intelligence Hyperlocal Insights POI & Store Locator DTC Brand Analytics NEW
 For Retailers
 E-Commerce Dashboard
 Flipkart Insights (Live) #1
 Grocery Intelligence
.svg) Grocery Price (U.S.)
Grocery Price (U.S.)
.svg) Quick Commerce (India) HOT
Quick Commerce (India) HOT
 Food & Restaurant
 Fashion Intelligence
 Automotive
 Travel & Hospitality
 Real Estate
 Food Delivery Intelligence NEW
 OTT & Streaming NEW
 Fuel & EV Charging Price Tracker NEW
 By Use Case
 Pricing Intelligence
 Digital Shelf Analytics
 MAP Monitoring HOT
 Cross-Border Price Parity NEW
 Share of Search
 Review Sentiment
 Kitchen Market Gaps NEW
 Dynamic Pricing / AI Repricing NEW
 Promotions & Deals Alerts NEW
 B2B / POI & Lead Data NEW
 AI Search Visibility Dashboard NEW
 Baby Products on Quick Commerce NEW
 Hotel & Flight Rate Parity NEW
 By Region🇮🇳 India 🇺🇸 USA 🇦🇪 Middle East 🇬🇧 UK 🇦🇺 Australia 🌏 SE Asia 🇪🇺 Europe 🌎 LATAMIndia
 Flipkart Real-Time Insights
 Quick Commerce — Zepto · Blinkit
 Pincode Price Tracker
Middle East
Pincode Price Tracker
Middle East GCC Q-Commerce — Talabat · Noon NEW
UK & Australia
GCC Q-Commerce — Talabat · Noon NEW
UK & Australia UK Grocery — Tesco, Sainsbury's, Asda
 AU Grocery — Coles & Woolworths NEW
 Marketplace Scrapers
Amazon API TikTok Shop API HOT Uber Eats API Airbnb API Zepto / Blinkit API Instacart API NEW Talabat API NEW
Marketplace Scrapers
Amazon API TikTok Shop API HOT Uber Eats API Airbnb API Zepto / Blinkit API Instacart API NEW Talabat API NEW Developer APIsWeb Extract API Reviews API SERP API Pricing Webhook NEW
 Universal APIsStreaming Crawl API Scheduler Realtime Alerts Webhook Delivery 🐍 Python SDK 💚 Node.js SDK
 Delivery & SDKs
 Knowledge Center
Digital Shelf Playbook MAP Compliance Guide Pricing Intel Guide Scraping Compliance TikTok Shop Guide NEW Cross-Border Guide NEW
Knowledge Center
Digital Shelf Playbook MAP Compliance Guide Pricing Intel Guide Scraping Compliance TikTok Shop Guide NEW Cross-Border Guide NEW Guides & Playbooks
🎉 Seasonal & event tracking NEWBlack Friday pricing report Festive season, India Ramadan, GCC grocery All seasonal reportsSample Datasets HOT ROI Calculator NEW API Postman Collection Demo Dashboards Free API Playground NEW Press Kit
Guides & Playbooks
🎉 Seasonal & event tracking NEWBlack Friday pricing report Festive season, India Ramadan, GCC grocery All seasonal reportsSample Datasets HOT ROI Calculator NEW API Postman Collection Demo Dashboards Free API Playground NEW Press Kit Downloads & Tools
Trust Center About Us FAQs Careers
Downloads & Tools
Trust Center About Us FAQs Careers Trust & CompanyRetail shelf research NEWRetail shelf research






































 4.8/5 Average Rating
 50+ Video Testimonials
 92% Client Retention
 50+ Countries Served


.webp)