Introduction
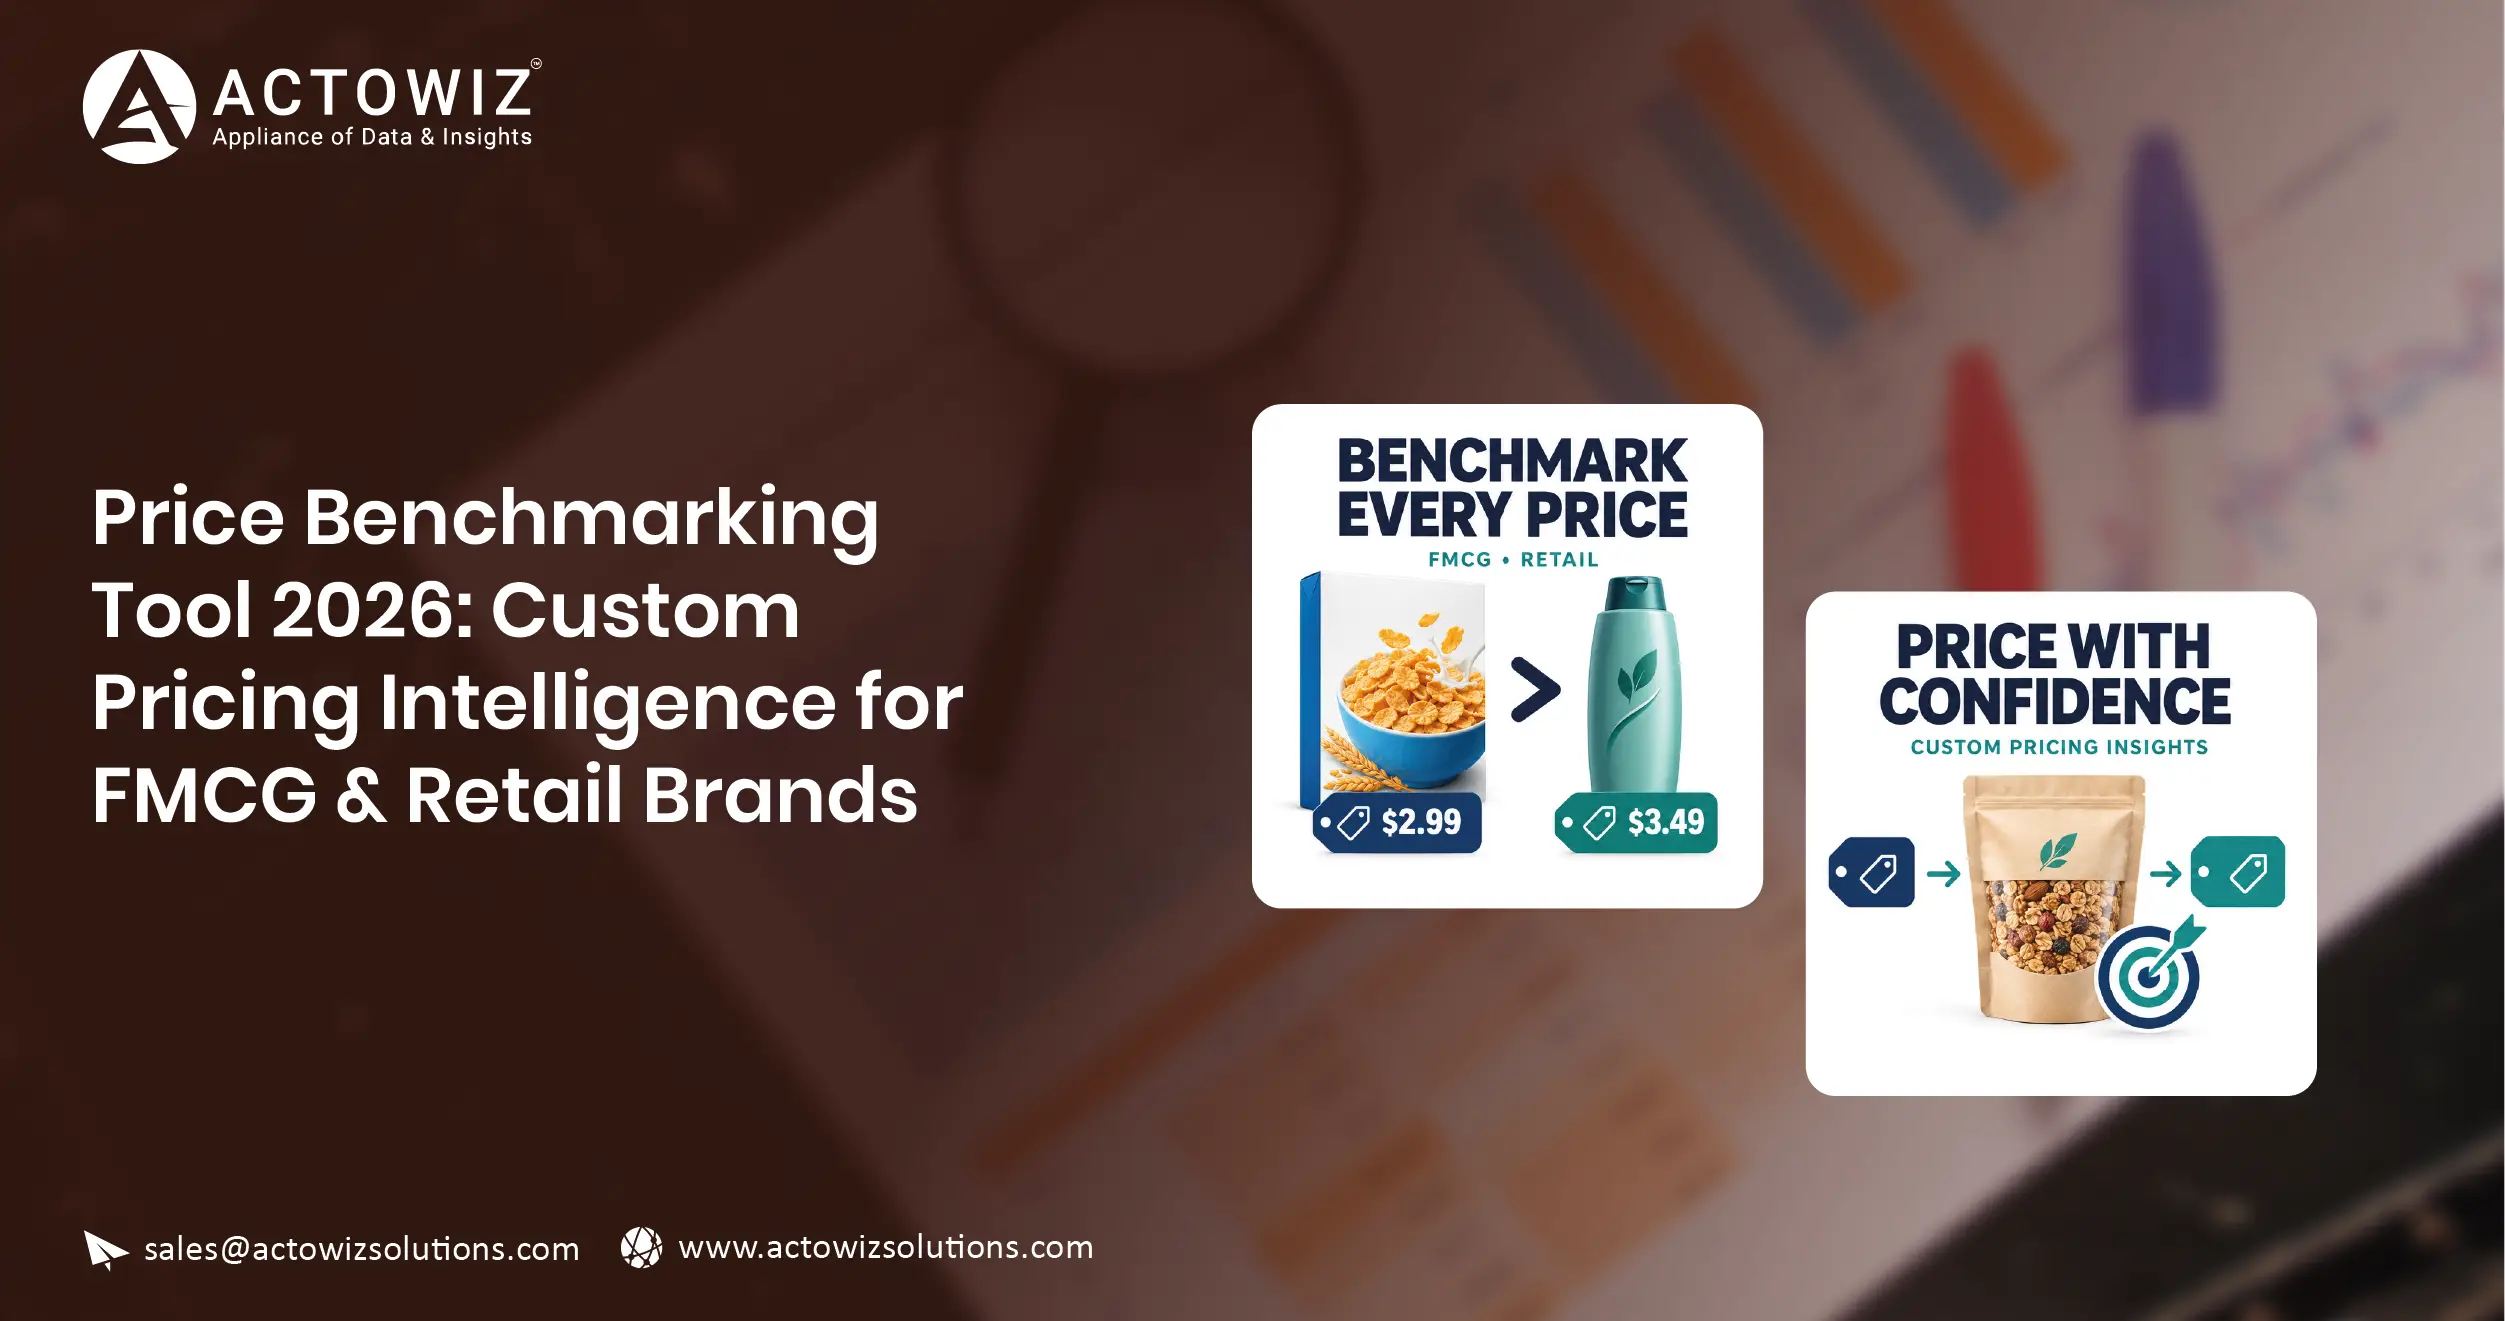
Price Benchmarking Tool 2026 helps FMCG and retail brands compare product prices across competitors, retailers, channels, SKUs, and markets so they can identify pricing gaps before those gaps affect margins or market position. It replaces fragmented manual comparisons with structured, repeatable pricing intelligence.
The need is increasingly urgent. U.S. retail e-commerce sales reached $300.2 billion in Q1 2025 and represented 16.2% of total retail sales. E-commerce sales were also up 6.1% year over year.
For FMCG and retail decision-makers, the problem is no longer simply knowing a competitor's price. The real challenge is understanding why the price changed, how widely the change has spread, whether the product is comparable, and what action should follow.
A modern E-commerce Dashboard can bring these signals together by showing current prices, historical movements, competitor gaps, promotional activity, SKU availability, and market-level benchmarks in one decision environment.
The strongest pricing programs therefore combine automated data collection, SKU normalization, historical comparisons, competitive monitoring, and business rules. This enables pricing teams to move from reactive spreadsheet analysis to continuous market intelligence.
What Pricing Problems Are FMCG and Retail Teams Trying to Solve?
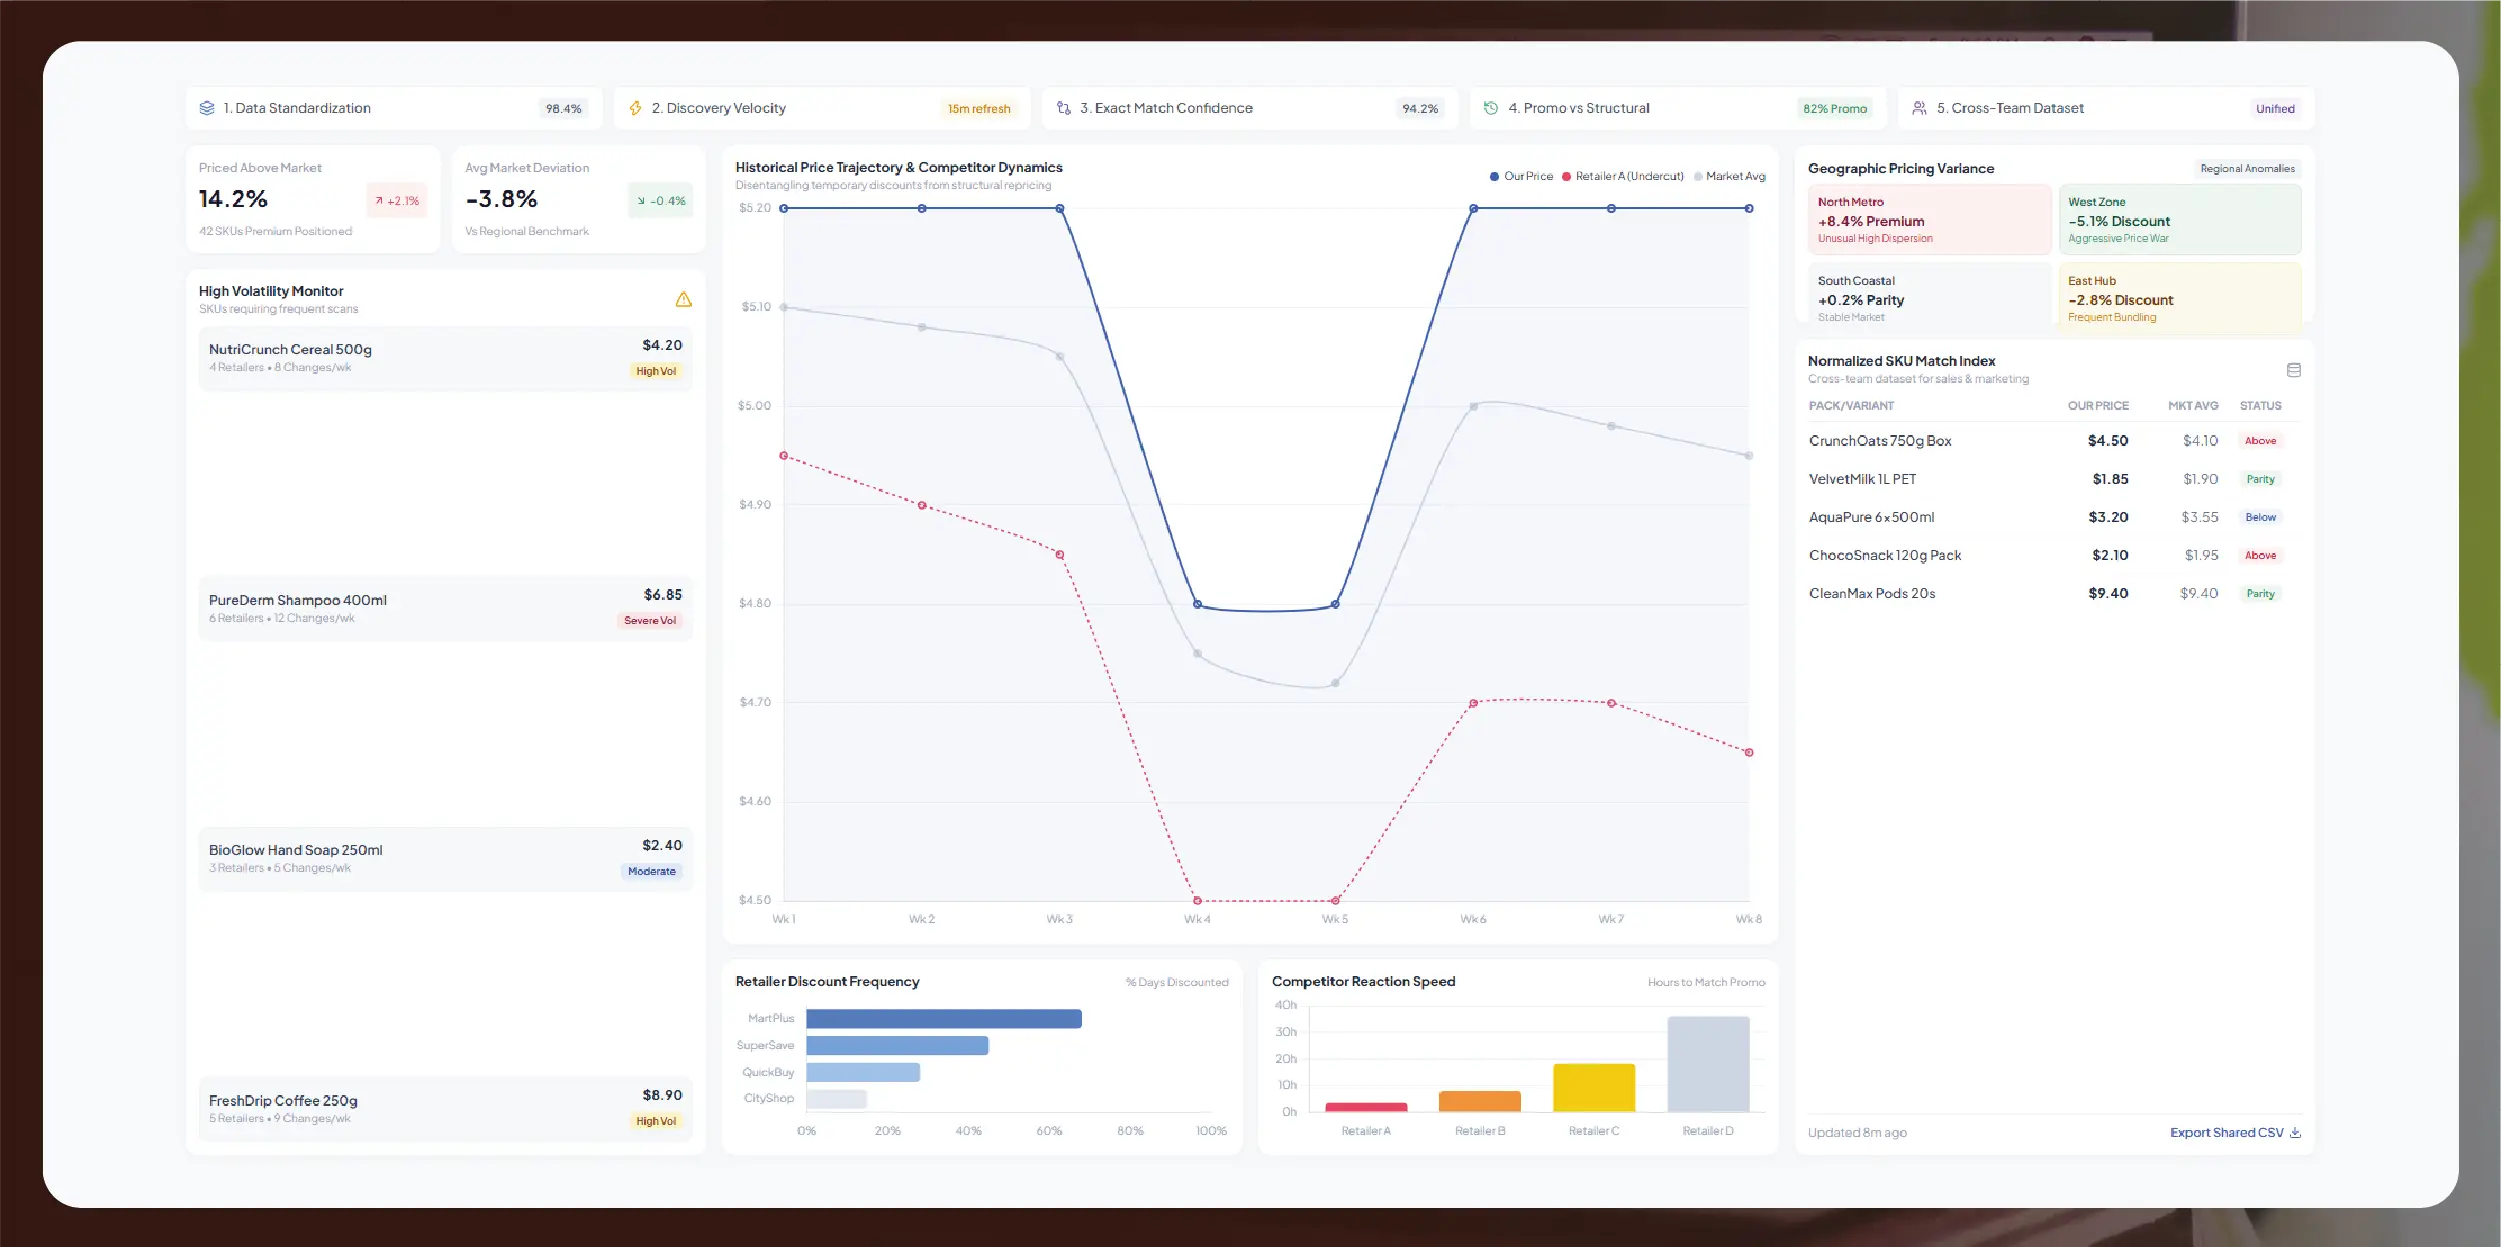
Pricing teams typically face five connected problems:
- Inconsistent competitor data — Retailers display product names, sizes, pack configurations, and promotions differently.
- Slow price discovery — Manual monitoring cannot reliably capture frequent changes across large assortments.
- Poor product matching — A different pack size or variant can make a direct comparison misleading.
- Limited historical context — A current price does not explain whether the product is temporarily discounted or structurally repriced.
- Disconnected decision-making — Pricing, sales, category management, and marketing teams may work from different datasets.
The solution is not necessarily collecting the largest possible dataset. It is creating a consistent benchmark dataset that answers a defined commercial question.
For example, a brand may need to know:
- Where are our products priced above the market?
- Which competitors consistently undercut us?
- Which SKUs experience the greatest price volatility?
- Which retailers discount most frequently?
- What is the average market price by SKU?
- Which geographic markets show unusual pricing?
- How quickly are competitors responding to our promotions?
- Which products require more frequent monitoring?
The following sections show how an automated pricing intelligence framework can answer these questions.
How Can Automated Data Collection Create a Reliable Market Baseline?
FMCG & Retail Price Benchmarking Data Scraping creates the raw market dataset required to compare products consistently across digital retail channels.
A useful collection framework should capture more than a displayed price. Depending on the source and business requirement, the dataset can include:
| Data Point |
Business Value |
| Product name |
Product identification |
| Brand |
Brand comparison |
| SKU ID |
Precise product matching |
| Category |
Category benchmarking |
| Pack size |
Like-for-like comparison |
| Regular price |
Baseline price |
| Promotional price |
Discount analysis |
| Discount percentage |
Promotion measurement |
| Availability |
Supply visibility |
| Retailer |
Competitive comparison |
| Geography |
Regional benchmarking |
| Product URL |
Source verification |
| Timestamp |
Historical tracking |
The most important principle is like-for-like comparison.
If Brand A sells a 500 g package for $5.49 and Brand B sells a 750 g package for $6.49, simply comparing shelf prices can produce the wrong conclusion. A better benchmark can normalize pack sizes where appropriate and distinguish between absolute price and unit price.
What Do the 2020–2026 Trends Tell Us?
The shift toward digital retail accelerated dramatically during the pandemic. U.S. e-commerce sales increased by $244.2 billion, or 43%, in 2020, reaching $815.4 billion, according to the U.S. Census Bureau.
Retail grocery was also significant: U.S. grocery store sales increased 9.4% in 2020, from $694.3 billion in 2019 to $759.7 billion.
By 2025, quarterly e-commerce had become a much larger and more established component of retail. U.S. Q1 2025 e-commerce sales reached $300.2 billion on a seasonally adjusted basis.
In 2026, the implication is clear: brands need pricing data that reflects an omnichannel market rather than relying exclusively on periodic physical-store research.
| Year |
Market Development |
Pricing Intelligence Implication |
| 2020 |
E-commerce accelerated sharply |
Digital price visibility became critical |
| 2021 |
Retail demand normalized unevenly |
Competitor monitoring became more important |
| 2022 |
Inflation influenced consumer prices |
Price movement required more context |
| 2023 |
Consumers remained price sensitive |
Benchmarking supported value positioning |
| 2024 |
Omnichannel shopping matured |
Cross-channel comparisons gained importance |
| 2025 |
E-commerce represented 16.2% of U.S. retail sales in Q1 |
Digital price monitoring became mainstream |
| 2026 |
Pricing remains central to FMCG competition |
Continuous intelligence supports faster action |
Market figures are from U.S. Census Bureau sources; the strategic implications are Actowiz Solutions analysis.
How Does an Automated Benchmarking Engine Help FMCG Teams?
An FMCG Price Benchmarking Tool can turn raw retailer observations into comparable pricing metrics.
Instead of presenting hundreds of unstructured product records, the system can calculate:
- Market average price
- Median market price
- Minimum and maximum price
- Price difference versus benchmark
- Competitor price index
- Promotional discount
- Price position
- Retailer-level deviation
- SKU-level volatility
- Geographic price variance
For example, consider an illustrative product priced across five retailers:
| Retailer |
Observed Price |
Market Average |
Difference |
| Retailer A |
$9.99 |
$10.59 |
-5.7% |
| Retailer B |
$10.49 |
$10.59 |
-0.9% |
| Retailer C |
$11.49 |
$10.59 |
+8.5% |
| Retailer D |
$10.99 |
$10.59 |
+3.8% |
| Retailer E |
$9.99 |
$10.59 |
-5.7% |
The commercial insight is not simply that Retailer C charges $11.49. The more useful finding is that Retailer C is positioned approximately 8.5% above the calculated market average.
A pricing team can then investigate whether the difference results from:
- A premium positioning strategy
- A temporary promotional gap elsewhere
- Different pack configurations
- Regional operating costs
- Retailer-specific pricing policy
- Delayed price updates
- Competitive assortment differences
What Changed Between 2020 and 2026?
The pricing environment evolved from broad inflation-led price increases toward a more complex balance between margin protection, consumer affordability, and competitive positioning.
Deloitte noted that consumer-products companies frequently relied on price increases between 2021 and 2023 as input costs rose, but by 2025 many executives no longer expected significant price-taking to provide the same growth benefits.
That creates a strategic problem for FMCG companies: when raising prices becomes harder, better measurement becomes more valuable.
Benchmarking helps pricing teams determine whether a proposed increase is consistent with the competitive market rather than relying solely on internal cost calculations.
How Can Brands Build Custom Pricing Intelligence Across Categories?
Custom Pricing Data Intelligence For FMCG & Retail allows brands to define benchmarking rules around their specific products, competitors, channels, and commercial objectives.
A manufacturer may care primarily about competitor price gaps. A retailer may prioritize supplier pricing and category margins. A marketplace seller may focus on buy-box movement and competitor availability.
The same dataset can therefore support different analytical models.
Example: Three Buyer Personas
| Buyer Persona |
Primary Pain Point |
Useful Intelligence |
| FMCG Brand Manager |
Competitor undercutting |
Price index and competitor gap |
| Retail Category Manager |
Margin pressure |
Market benchmark and supplier comparison |
| Pricing Analyst |
Too many manual checks |
Automated alerts and historical trends |
A custom system can apply different rules to each use case.
For instance, a brand could define an alert when:
Competitor price < Brand benchmark by 8%
Or:
Three or more retailers change price within 24 hours
Or:
SKU price falls more than 10% from its 30-day average
These rules turn static price data into operational intelligence.
How Did Pricing Intelligence Evolve From 2020 to 2026?
In 2020, many organizations prioritized digital visibility because consumer shopping behavior changed rapidly. By 2022 and 2023, inflation and input-cost pressures made price management a major commercial issue.
By 2026, the challenge is more sophisticated: businesses must balance price, promotion, pack architecture, channel differences, consumer sensitivity, and competitor behavior.
NIQ's 2026 India FMCG research illustrates this increasingly complex environment. Its Q2 2026 snapshot reports that e-commerce reached 7% of FMCG sales nationally and highlights pricing as an important performance factor across food and home/personal-care categories.
NIQ also reported that e-commerce accounted for 18% of FMCG sales in India's top eight metros in OND 2025.
The lesson is applicable beyond India: channel-specific pricing intelligence is becoming essential as consumers move between traditional retail, modern trade, marketplaces, and e-commerce.
Why Is SKU-Level Monitoring Essential for Accurate Comparisons?
FMCG & Retail SKU-level price tracking provides the foundation for reliable product-level benchmarking.
A category-level average can hide substantial differences. For example, a shampoo category may appear stable overall while three high-volume SKUs experience major price changes.
SKU-level monitoring makes those movements visible.
A robust SKU record should ideally connect:
Brand → Product → Variant → Pack Size → SKU → Retailer → Market → Price → Promotion → Timestamp
This structure prevents common comparison errors.
What Can SKU-Level Monitoring Reveal?
- Price increases by individual product
- Competitor undercutting
- Promotional frequency
- Pack-size changes
- Availability changes
- Retailer-specific price deviations
- Regional price differences
- New competitor launches
- Discontinued products
- Unusual price volatility
Consider an illustrative monitoring example:
| SKU |
Previous Price |
Current Price |
Change |
Status |
| SKU-A |
$7.99 |
$8.49 |
+6.3% |
Monitor |
| SKU-B |
$12.49 |
$11.49 |
-8.0% |
Promotion signal |
| SKU-C |
$5.99 |
$5.99 |
0% |
Stable |
| SKU-D |
$15.99 |
$17.49 |
+9.4% |
Review |
| SKU-E |
$9.49 |
$8.99 |
-5.3% |
Competitive movement |
What Does 2020–2026 Tell Pricing Teams?
The growth of digital commerce has made SKU-level observation increasingly practical. It also increased the volume and frequency of pricing signals.
The U.S. Census Bureau reported that e-commerce accounted for 16.2% of total retail sales in Q1 2025.
For pricing teams, that means online observations increasingly represent a meaningful part of the competitive environment. However, online prices should still be interpreted alongside channel, geography, pack size, availability, and promotional context.
SKU-level tracking provides the granularity required to make that interpretation.
How Can Historical Pricing Reveal Long-Term Market Patterns?
FMCG & Retail Historical prices Data API enables organizations to preserve structured price observations and use them as a historical reference layer.
Historical data is critical because today's price is rarely meaningful without yesterday's price.
Suppose a competitor currently lists a product at $7.99. Without historical information, a brand cannot immediately determine whether this is:
- A normal price
- A new permanent price
- A weekend promotion
- A clearance event
- A seasonal discount
- A retailer error
- A temporary response to another competitor
A historical API dataset can preserve observations such as:
| Date |
Retailer |
Price |
Promotion |
Availability |
| Jan 2026 |
Retailer A |
$8.99 |
No |
In stock |
| Feb 2026 |
Retailer A |
$8.49 |
No |
In stock |
| Mar 2026 |
Retailer A |
$7.99 |
Yes |
In stock |
| Apr 2026 |
Retailer A |
$8.49 |
No |
In stock |
| May 2026 |
Retailer A |
$8.49 |
No |
In stock |
This history shows that the $7.99 price may have been promotional rather than a permanent repricing.
How Did Historical Context Become More Important Between 2020 and 2026?
The rapid expansion of digital commerce created more frequent price observations. At the same time, inflation and changing consumer demand made it harder to interpret individual price points in isolation.
U.S. retail sales increased from $5.57 trillion in 2020 to $6.52 trillion in 2021, a 17.1% increase, according to Census Bureau Annual Retail Trade Survey estimates.
The scale of the retail environment means pricing teams increasingly need structured historical data rather than occasional snapshots.
By 2026, historical price intelligence can help answer more strategic questions:
- Is a competitor permanently repositioning?
- Which products have become more price sensitive?
- Which retailers promote most aggressively?
- How long do promotions typically last?
- Which SKUs have the highest volatility?
- Are price changes seasonal?
- How quickly does the market respond to a new price?
Can Dynamic Pricing Intelligence Improve Faster Decision-Making?
Dynamic pricing intelligence for FMCG & Retail connects real-time observations with predefined commercial rules so teams can respond faster to market changes.
The goal is not to automate every pricing decision. The goal is to automate visibility and prioritization.
For example, a system can rank pricing events:
| Event |
Severity |
Suggested Response |
| Competitor -2% |
Low |
Monitor |
| Competitor -5% |
Medium |
Review |
| Competitor -10% |
High |
Investigate |
| Three competitors -8% |
Critical |
Pricing review |
| Own SKU +10% vs market |
High |
Validate positioning |
| Major retailer promotion |
Medium |
Evaluate campaign impact |
This enables pricing teams to focus on exceptions rather than manually reviewing every product every day.
What Does 2020–2026 Market Evolution Suggest?
The evolution of retail demonstrates a clear move toward faster, more connected decision-making.
In 2020, e-commerce's share of U.S. retail sales reached 16.1% in Q2 on a seasonally adjusted basis, according to the Census Bureau.
By Q1 2025, e-commerce represented 16.2% of total retail sales, while sales increased 6.1% year over year.
Meanwhile, FMCG markets have become increasingly omnichannel. NIQ's 2026 India research shows e-commerce continuing to gain FMCG share, including 18% across the country's top eight metros.
This environment makes dynamic monitoring valuable because competitive movements can emerge at different speeds across retailers and channels.
How Can Actowiz Solutions Help Build a Scalable Pricing Intelligence System?
Actowiz Solutions builds customized data pipelines for brands and retailers that need consistent market visibility rather than isolated data extraction.
Our Data Intelligence Services can be structured around the client's products, retailers, geographies, categories, competitors, and reporting requirements.
Define the Benchmarking Framework
We begin by identifying what the business actually wants to benchmark:
- Products
- Competitors
- Retailers
- Categories
- Pack sizes
- Regions
- Promotions
- Price positions
This prevents unnecessary data collection.
Build Product and SKU Mapping
Products are matched using available identifiers and attributes such as:
- SKU ID
- Product name
- Brand
- Variant
- Pack size
- Category
- Retailer-specific identifiers
This creates a reliable foundation for like-for-like comparisons.
Automate Data Collection
The system can collect relevant product and pricing information on a defined schedule according to the business's monitoring requirements.
Frequency can be adjusted based on price volatility, business importance, and competitive activity.
Normalize Pricing Data
Different retailers often use different formats. Data normalization can standardize:
- Currency
- Decimal formats
- Pack sizes
- Discounts
- Promotions
- Product naming
- Availability statuses
Validate the Dataset
Quality controls can detect:
- Missing prices
- Duplicate products
- Unexpected price changes
- Product mismatches
- Invalid URLs
- Inconsistent SKU mappings
Create Historical Records
Develop Alerts and Benchmarks
Every observation can be timestamped so pricing s can compare today's market against previous periods.
Businesses can define custom thresholds such as:
- Competitor price falls 5%
- Own price exceeds market average by 7%
- Promotional price appears
- Product becomes unavailable
- Multiple competitors change prices simultaneously
Deliver Analytics-Ready Data
The final dataset can support dashboards, databases, BI systems, reporting workflows, and internal applications.
The architecture can begin with a focused product set and scale to broader retailer, category, geography, and SKU coverage as the business grows.
What Should a Market-Leading Benchmarking Dataset Include?
A high-quality benchmarking solution should connect raw observations with analytical context.
| Layer |
Example Data |
| Product |
Brand, name, category |
| SKU |
Internal and retailer SKU |
| Variant |
Size, flavor, model, pack |
| Retailer |
Retailer name and channel |
| Geography |
Country, state, city |
| Price |
Regular and promotional |
| Promotion |
Discount and offer type |
| Availability |
In stock/out of stock |
| Timing |
Date and timestamp |
| Benchmark |
Average, median, index |
| Change |
Absolute and percentage movement |
| History |
Previous observations |
| Quality |
Validation status |
This architecture makes the data useful to multiple teams rather than limiting it to one pricing analyst.
Which Teams Can Use the Intelligence?
Pricing teams can evaluate market positioning.
Category managers can identify competitive gaps.
Sales teams can prepare account-level discussions.
Marketing teams can evaluate promotional environments.
E-commerce teams can monitor online price competitiveness.
Executives can review category-level trends and strategic exceptions.
The key advantage is a shared source of structured market truth.
Why Should FMCG and Retail Brands Invest in Benchmarking Now?
The retail environment is too dynamic for periodic manual price checks to provide complete visibility.
The U.S. Census Bureau's latest data shows retail e-commerce sales reached $316.1 billion in Q4 2025 on a seasonally adjusted basis, accounting for 16.6% of total retail sales.
At the same time, FMCG companies are operating in a market where pricing remains a major determinant of performance. NIQ's 2026 research describes heightened volatility in India's FMCG market, with inflation, consumer price sensitivity, GST changes, and shifting channel dynamics influencing growth.
For brands operating across multiple retailers, these conditions create three priorities:
- Visibility — Know what competitors are charging.
- Context — Understand whether changes are temporary or structural.
- Speed — Identify important changes before they become commercial problems.
A modern benchmarking system addresses all three.
Conclusion
Pricing is no longer a once-a-month spreadsheet exercise. For FMCG and retail brands, competitive prices can change across products, retailers, regions, promotions, and channels at different speeds.
A structured benchmarking framework gives decision-makers the ability to compare like-for-like products, identify meaningful price gaps, understand historical movements, and prioritize the changes that deserve immediate attention.
The strongest approach combines automated data collection, accurate SKU matching, historical price records, benchmark calculations, alerts, and analytics. It also keeps the commercial objective at the center: helping pricing teams make faster and better decisions without drowning in raw data.
Actowiz Solutions can build a customized solution around your product catalog, target retailers, markets, monitoring frequency, and pricing objectives.
Ready to transform competitive pricing data into actionable intelligence? Contact Actowiz Solutions to build a customized pricing benchmarking and market-monitoring solution for your FMCG or retail business!
You can also reach us for all your mobile app scraping, data collection, web scraping , and instant data scraper service requirements!

 By industry🏷 By platform🌐 By market
 Pricing & Promotions
MAP Violations Brand Protection Counterfeit Detection Price Intelligence AI HOT Data Intelligence
 Brand & Intelligence
Share of Search Content Audit & PDP Reviews & Ratings Retail Media Buy Box Monitoring Social Commerce HOT Live Commerce NEW Agentic Commerce NEW
 Digital Shelf & Search
Assortment Planning Competitive Benchmarking Product Availability Q-Commerce NEW
 AssortmentE-commerce Intelligence Hyperlocal Insights POI & Store Locator DTC Brand Analytics NEW
 For Retailers
 E-Commerce Dashboard
 Flipkart Insights (Live) #1
 Grocery Intelligence
.svg) Grocery Price (U.S.)
.svg) Quick Commerce (India) HOT
 Food & Restaurant
 Fashion Intelligence
 Automotive
 Travel & Hospitality
 Real Estate
 Food Delivery Intelligence NEW
 OTT & Streaming NEW
 Fuel & EV Charging Price Tracker NEW
 By Use Case
 Pricing Intelligence
 Digital Shelf Analytics
 MAP Monitoring HOT
 Cross-Border Price Parity NEW
 Share of Search
 Review Sentiment
 Kitchen Market Gaps NEW
 Dynamic Pricing / AI Repricing NEW
 Promotions & Deals Alerts NEW
 B2B / POI & Lead Data NEW
 AI Search Visibility Dashboard NEW
 Baby Products on Quick Commerce NEW
 Hotel & Flight Rate Parity NEW
 By Region🇮🇳 India 🇺🇸 USA 🇦🇪 Middle East 🇬🇧 UK 🇦🇺 Australia 🌏 SE Asia 🇪🇺 Europe 🌎 LATAMIndia
 Flipkart Real-Time Insights
 Quick Commerce — Zepto · Blinkit
 Pincode Price Tracker
Middle East
 GCC Q-Commerce — Talabat · Noon NEW
UK & Australia
 UK Grocery — Tesco, Sainsbury's, Asda
 AU Grocery — Coles & Woolworths NEW
 Marketplace Scrapers
Amazon API TikTok Shop API HOT Uber Eats API Airbnb API Zepto / Blinkit API Instacart API NEW Talabat API NEW
 Developer APIsWeb Extract API Reviews API SERP API Pricing Webhook NEW
 Universal APIsStreaming Crawl API Scheduler Realtime Alerts Webhook Delivery 🐍 Python SDK 💚 Node.js SDK
 Delivery & SDKs
 Knowledge Center
Digital Shelf Playbook MAP Compliance Guide Pricing Intel Guide Scraping Compliance TikTok Shop Guide NEW Cross-Border Guide NEW
 Guides & Playbooks
🎉 Seasonal & event tracking NEWBlack Friday pricing report Festive season, India Ramadan, GCC grocery All seasonal reportsSample Datasets HOT ROI Calculator NEW API Postman Collection Demo Dashboards Free API Playground NEW Press Kit
 Downloads & Tools
Trust Center About Us FAQs Careers
 Trust & CompanyRetail shelf research NEWRetail shelf research


 4.8/5 Average Rating
 50+ Video Testimonials
 92% Client Retention
 50+ Countries Served