Core services
Enterprise Data Extraction

Scalable web, app and AI-powered collection across 40+ countries.

All 58 services →
New 2026
AI Training Data

Corpus building with provenance and opt-out compliance.

Learn more →
Free pilot
24-hour sample

We run collection on your own sources before you commit.

Get a sample →
58Services
40+Countries
DEVELOPER

Ready-Made Scrapers

Pre-built for top platforms. Self-serve, no setup.

View All →
TRY FREE

API Playground

Test endpoints instantly. No credit card.

Start Free →
28Tools
2SDKs
icons Delivery & SDKs
Streaming Crawl API Scheduler Realtime Alerts Webhook Delivery 🐍 Python SDK 💚 Node.js SDK

Need it managed instead?

Fixed monthly retainer, named engineer, no per-request metering.

Managed Data API →
HOT

Case Studies

How brands use Actowiz, with named outcomes.

Read →
FREE

Sample Datasets

Real output, no signup.

Download →
NEW

ROI Calculator

Model the return on a data engagement.

Calculate →
Food delivery commission and menu price markup analysis for restaurants

Introduction

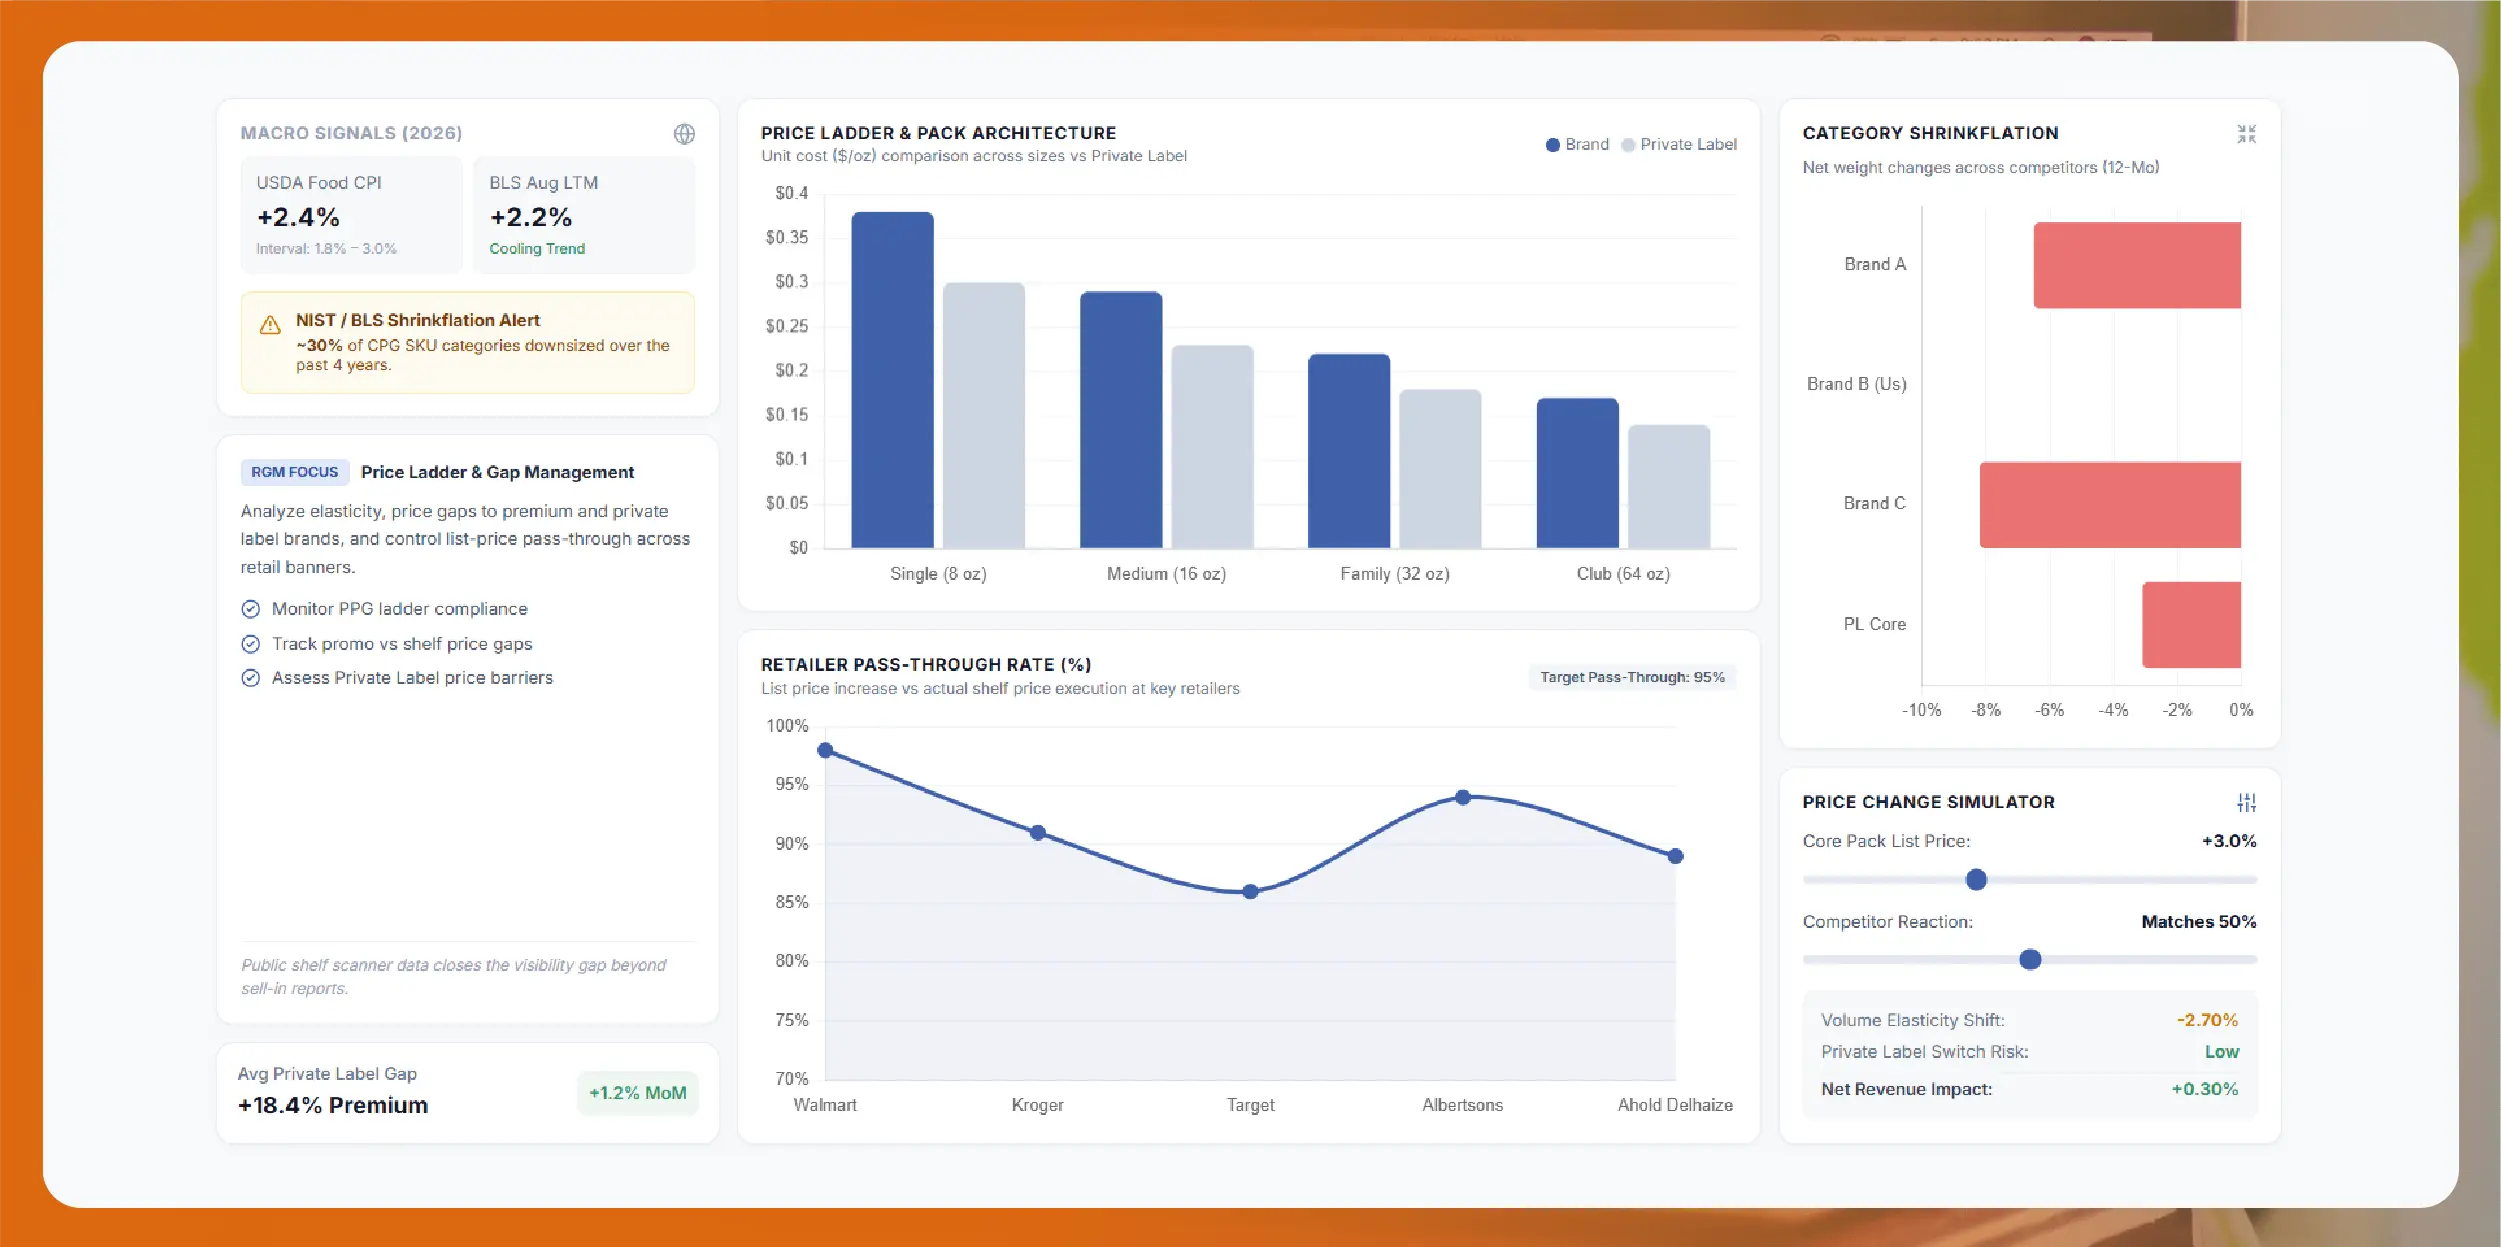
US revenue growth management (RGM) teams are under pressure from two directions. Shoppers compare unit prices more closely than ever, and retailers push private label and their own promo calendars harder. Getting price pack architecture data for the US market right is now a core input for pricing, pack and promo decisions.

Direct answer: Price pack architecture data for US CPG brands is a regular, store-level record of shelf price, promo price, loyalty or digital-coupon price, pack size, multipack count and unit price (per ounce or per count) for your SKUs, competitors and private label. Teams collect it from public pages at Walmart, Kroger, Target, Amazon, Instacart and others, by ZIP code.

This guide covers which US retailers matter, how to normalize unit prices, how to match products by UPC/GTIN, refresh cadence around US promo events, and what to ask a provider about SLA, QA and delivery to Snowflake or BigQuery.

Why does price pack architecture data matter for US CPG brands in 2026?

Food delivery commission and menu price markup analysis for restaurants

Food inflation in the US has cooled but not stopped. The USDA Economic Research Service forecasts food-at-home prices to rise 2.4% in 2026 (interval 1.8% to 3.0%), after 2.3% in 2025 (https://www.ers.usda.gov/data-products/food-price-outlook/summary-findings, September 2026 release). The Bureau of Labor Statistics reported food-at-home prices up 2.2% in the 12 months to August 2026 (https://www.bls.gov/news.release/cpi.nr0.htm).

Each list-price increase or pack-size change ripples through the price ladder, and shoppers trade between sizes, switch to private label or wait for a promo. NIST notes that "approximately 30% of consumer goods have been downsized and likely affected by shrinkflation over the past 4 years," citing a BLS analysis (https://www.nist.gov/programs-projects/uniform-unit-pricing-tools-consumers-fight-shrinkflation).

Sell-in and scanner data show what sold. They do not always show what the shopper saw at a given store on a given day: the shelf price, the "with card" price, the coupon, the competing pack or the out-of-stock. Public retailer data fills that gap.

Who uses it inside a CPG company:

  • RGM and pricing teams – check price ladders, price gaps to competitors and private label, and pass-through of list-price changes.
  • Category and sales teams – prepare joint business planning with retailer-specific evidence.
  • Insights and strategy – track pack-size changes across the category, including competitor shrinkflation signals.

Which US retailers should a PPA data program cover?

Most US CPG programs start with mass, grocery and e-commerce, then add drug, dollar and club. The table shows what is typically visible on public pages; exact fields vary by retailer, category and store.

Retailer / platform Price types usually visible publicly Store / ZIP-level? Product identifier on public pages Notes
Walmart (walmart.com) Shelf price, rollback / clearance, unit price, multipack Yes, by selected store UPC/GTIN where shown on the page; otherwise item ID Store context recorded
Kroger and banners (Ralphs, Fred Meyer, King Soopers and others) Regular price, promo price, "with card" price where shown, unit price Yes, by selected store UPC where shown Public offers only; no coupon clipping
Target (target.com) Shelf price, Circle offers shown on page, unit price Yes, by selected store UPC/TCIN where shown Offers recorded as text
Albertsons / Safeway and banners Regular price, member price, promo, unit price Yes, by selected store UPC where shown No login used
Costco (costco.com) Publicly listed prices and pack counts Limited Costco item number only Prices only. Costco item-to-UPC/GTIN mapping is not offered
Amazon (amazon.com, incl. grocery) Price, Subscribe & Save price shown, coupon badge, unit price Partly, by delivery ZIP ASIN (UPC rarely shown) Seller context captured
Instacart Retailer prices shown on Instacart, promos, unit price Yes, by ZIP and store Retailer product ID; UPC where shown May differ from in-store
Walgreens / CVS Regular, sale and member prices shown, unit price Yes, by selected store UPC where shown HBC and household
Dollar General Shelf price, promo, pack size Yes, by selected store UPC where shown Key for small packs
Regional grocers (e.g. H-E-B, Publix, Meijer, Wegmans) Shelf and promo prices, unit price where shown Usually by store Varies Scoped per region

All collection uses public pages, respects site terms and never bypasses logins; signed-in or personal pricing is out of scope.

What data fields does a US price pack architecture dataset need?

A useful dataset is more than "price per SKU". These are the fields RGM teams usually ask for:

  • Retailer, banner, store ID and ZIP code – so you can compare like-for-like and map to your own regions.
  • Product identity – retailer product ID, product name, brand, UPC/GTIN where shown on the public page, and a mapped internal SKU.
  • Pack attributes – net contents (oz, fl oz, lb, count), pack count for multipacks, and package type (single, bundle, value pack, club).
  • Shelf price – the regular everyday price in USD.
  • Promo price and mechanic – sale price, "2 for $5", "buy 2 get 1", rollback, with start and end dates where shown.
  • Loyalty / digital-coupon price – member or "with card" price and coupon text, only where displayed publicly.
  • Unit price – as shown by the retailer, plus a recalculated, normalized unit price (see the next section).
  • Private-label flag – whether the item is a store brand (Great Value, Kroger, Good & Gather, Signature Select and others), for price-gap analysis.
  • Availability – in stock, out of stock, limited stock, or delivery/pickup only where shown.
  • Timestamp and capture context – date, time, fulfillment mode and page URL, for audit and QA.

How do you normalize unit prices for PPA analysis?

Retailer unit prices are a helpful starting point but not always consistent. One store may show a price per ounce, another per pound, and multipacks may be shown per count. NIST's Handbook 130 includes a Uniform Unit Pricing Regulation (UUPR). NIST says it "applies only when stores voluntarily provide unit pricing information," and that nineteen states and two territories have unit pricing laws or regulations. The NIST SP 1181 Unit Pricing Guide (2025 edition, https://www.nist.gov/publications/nist-sp-1181-unit-pricing-guide-best-practice-approach-unit-pricing-2025-ed) sets out best practices for consistent unit price labels in stores and online.

For analysis, recalculate the unit price yourself rather than trusting the label alone:

  • Parse net contents from the title and size fields (e.g. "12 x 12 fl oz", "2 lb 4 oz", "48 ct").
  • Convert to one base unit per category – ounces for dry goods, fluid ounces for beverages, count for diapers, wipes, pods and tablets. Keep the same unit for every retailer in a category.
  • Multiply out multipacks – total contents = pack count × contents per unit.
  • Compute unit price for each price type – shelf, promo and loyalty price, each divided by total contents.
  • Flag mismatches – where the shown and recalculated unit prices differ beyond a tolerance, flag for review.
  • Keep the history – store net contents over time so that a change in size at the same shelf price shows up as a shrinkflation signal.

Worked example (hypothetical numbers, for illustration only): a 12-pack of 12 fl oz cans at $7.99 holds 144 fl oz, so the unit price is about $0.055 per fl oz. If the same brand's 6-pack is $4.49 for 72 fl oz, the unit price is about $0.062 per fl oz.

How do you read a price ladder by pack size?

With unit prices normalized, RGM teams build a price ladder per retailer and region. Use this template per retailer and ZIP cluster.

PPA tier Typical pack role Example pack (category-dependent) Shelf price (USD) Unit price (USD/oz or /ct) Private-label equivalent unit price Gap to private label
Entry / trial Low cash outlay, dollar and convenience Single-serve or small pack Pending Pending Pending Pending
Core Main volume driver Standard pack Pending Pending Pending Pending
Family / value Lower unit price, bigger basket Large or family size Pending Pending Pending Pending
Multipack Stock-up, promo-friendly 6, 12 or 24 count Pending Pending Pending Pending
Club Lowest unit price, bulk Club pack (Costco and similar, prices only) Pending Pending Pending Pending

What to look for:

  • Unit price inversions – a bigger pack with a higher unit price than a smaller one, often caused by a promo on the small pack or a recent list-price change.
  • Private-label gaps – the gap per ounce between your core pack and the store brand, by retailer and region.
  • Pack-size drift – competitor packs that shrink while the shelf price stays flat.
  • Regional spread – the same pack priced differently across ZIP clusters within one banner.

How do you match products across US retailers?

Matching is where many PPA projects stall. Use layers:

  • UPC/GTIN first – where the public page shows a UPC or GTIN, it is the strongest key to your product master.
  • Retailer IDs – Walmart item IDs, Target TCINs, Amazon ASINs and Instacart product IDs are stored and kept stable over time.
  • Attribute matching – brand, variant, flavor, net contents and pack count, with rules for variants such as "family size" or "value pack".
  • Human review – uncertain matches go to a reviewer before they reach your model.

Costco is the exception: we provide publicly listed Costco prices and pack details, but not Costco item-to-UPC/GTIN mapping. Club-pack matching uses attributes and your own product list.

How often should PPA data be refreshed around US promo events?

Weekly capture fits most PPA work, since many US grocery ads run weekly. Around major events, switch a focused SKU set to daily.

US event window Categories that usually move Suggested cadence
Super Bowl (late January to early February) Snacks, dips, beverages, beer and soft drinks Daily for event SKUs, weekly otherwise
Memorial Day Grilling, condiments, beverages, paper goods Daily during the event week
July 4th Grilling, beverages, snacks, frozen treats Daily during the event fortnight
Back to School (July to August) Lunchbox snacks, beverages, personal care Daily for key retailers, weekly elsewhere
Thanksgiving and Black Friday Baking, canned goods, beverages, household Daily from early November to Cyber Monday
Rest of year All tracked categories Weekly, plus ad-hoc checks after list-price changes

What are the main use cases for RGM and pricing teams?

  • Price-increase pass-through. Track when and how much each retailer moved shelf prices after your list-price change, by region.
  • PPA health checks. Find unit price inversions and crowded tiers across retailers.
  • Private-label gap tracking. Monitor the per-ounce gap to store brands at Walmart, Kroger, Target, Albertsons and others.
  • Shrinkflation monitoring. Spot competitor pack-size cuts at a stable price.
  • Promo compliance. Check promo price, mechanic and dates against the trade plan.
  • Availability-adjusted pricing. Read price gaps alongside out-of-stocks so an unavailable "cheap" competitor does not distort the picture.

Is collecting US retail price data legal, and what about CCPA/CPRA?

PPA data is public product and price data: prices, pack sizes, promo text and availability shown on retailer pages. It is not consumer personal data. The California Consumer Privacy Act, as amended by the CPRA, covers "information that identifies, relates to, or could reasonably be linked with" a consumer or household, and the California Attorney General states that "personal information does not include publicly available information" (California AG, CCPA page: https://oag.ca.gov/privacy/ccpa).

Good practice for a compliant program:

  • Collect only public product and price data. No shopper names, reviews tied to individuals, account data or personal pricing.
  • Do not log in, clip coupons or access account-only areas.
  • Respect each site's terms and technical limits, with polite crawl rates.
  • Document sources and methods for Legal review.

This is general information, not legal advice. Your legal team should review the program against your own policies and retailer agreements.

Build vs buy: how do you choose a PPA data provider?

Building in-house works for a handful of SKUs at one retailer. At scale – several retailers, hundreds of SKUs, many ZIP codes – maintenance becomes the main cost, because retailer pages and promo formats change often.

When you assess a provider, ask about:

  • Coverage – which retailers, banners, stores and ZIP codes, and which price types (shelf, promo, loyalty) per retailer.
  • Freshness – weekly and daily options, capture time windows and how event surges are handled.
  • Delivery – API, CSV/JSON, Amazon S3, Snowflake, BigQuery or Azure, with a stable schema and data dictionary.
  • SLA – delivery times, issue response times and how missed captures are re-run.
  • QA – unit-price recalculation checks, outlier detection on price swings, match-confidence scores, completeness reports per store and retailer.
  • Matching – UPC/GTIN where shown, retailer IDs, attribute rules and human review; clarity on limits such as Costco.
  • Security and usage rights – access controls, retention and internal usage terms.
  • Sample – a sample on your own SKUs and retailers before you commit.

Frequently Asked Questions

What is price pack architecture data?

A structured record of shelf, promo and loyalty prices, net contents, multipack counts, unit prices and availability across pack sizes, by retailer, store and date. RGM teams use it to manage price ladders, private-label gaps and promo plans.

Which US retailers can you cover for PPA analysis?

Typical coverage includes Walmart, Kroger and its banners, Target, Albertsons/Safeway, Costco (prices only), Amazon, Instacart, Walgreens, CVS, Dollar General and regional grocers. Exact stores, ZIP codes and price types are agreed in scoping.

Can you capture loyalty and digital-coupon prices?

Yes, where the retailer shows them publicly, for example a "with card" or member price on the product page. We do not log in, clip coupons or collect personal account pricing.

Do you provide UPC or GTIN for every product?

We capture UPC/GTIN where it is shown on the public page and use retailer IDs and attribute matching otherwise. Costco item-to-UPC/GTIN mapping is not offered.

How is the data delivered?

Through an API or as CSV/JSON files, or loaded directly to Amazon S3, Snowflake, BigQuery or Azure, on a weekly or daily schedule with a documented schema.

Get price pack architecture data for your US categories. Request an enterprise sample (24-hour turnaround) or book a scoping call. Use your company email and tell us your categories, retailers, ZIP codes or regions, and refresh frequency (weekly or daily around promo events). We will share a sample in your format – CSV, JSON, API, or a Snowflake / BigQuery load.
Contact Us Today!

Conclusion

You can also reach us for all your mobile app scraping, data collection, web scraping, and instant data scraper service requirements!

Social Proof That Converts

Trusted by Global Leaders Across Q-Commerce, Travel, Retail, and FoodTech

Our web scraping expertise is relied on by 4,000+ global enterprises including Zomato, Tata Consumer, Subway, and Expedia — helping them turn web data into growth.

4,000+ Enterprises Worldwide
50+ Countries Served
20+ Industries
Join 4,000+ companies growing with Actowiz →
Real Results from Real Clients

Hear It Directly from Our Clients

Watch how businesses like yours are using Actowiz data to drive growth.

▶
1 min
★★★★★
"Actowiz Solutions offered exceptional support with transparency and guidance throughout. Anna and Saga made the process easy for a non-technical user like me. Great service, fair pricing!"
TG
Thomas Galido
Co-Founder / Head of Product at Upright Data Inc.
▶
2 min
★★★★★
"Actowiz delivered impeccable results for our company. Their team ensured data accuracy and on-time delivery. The competitive intelligence completely transformed our pricing strategy."
II
Iulen Ibanez
CEO / Datacy.es
▶
1:30
★★★★★
"What impressed me most was the speed — we went from requirement to production data in under 48 hours. The API integration was seamless and the support team is always responsive."
FC
Febbin Chacko
-Fin, Small Business Owner
icons 4.8/5 Average Rating
icons 50+ Video Testimonials
icons 92% Client Retention
icons 50+ Countries Served

Join 4,000+ Companies Growing with Actowiz

From Zomato to Expedia — see why global leaders trust us with their data.

Why Global Leaders Trust Actowiz

Backed by automation, data volume, and enterprise-grade scale — we help businesses from startups to Fortune 500s extract competitive insights across the USA, UK, UAE, and beyond.

icons
7+
Years of Experience
Proven track record delivering enterprise-grade web scraping and data intelligence solutions.
icons
4,000+
Projects Delivered
Serving startups to Fortune 500 companies across 50+ countries worldwide.
icons
200+
In-House Experts
Dedicated engineers across scrapers, AI/ML models, APIs, and data quality assurance.
icons
9.2M
Automated Workflows
Running weekly across eCommerce, Quick Commerce, Travel, Real Estate, and Food industries.
icons
270+ TB
Data Transferred
Real-time and batch data scraping at massive scale, across industries globally.
icons
380M+
Pages Crawled Weekly
Scaled infrastructure for comprehensive global data coverage with 99% accuracy.

AI Solutions Engineered
for Your Needs

→
LLM-Powered Attribute Extraction: High-precision product matching using large language models for accurate data classification.
→
Advanced Computer Vision: Fine-grained object detection for precise product classification using text and image embeddings.
→
GPT-Based Analytics Layer: Natural language query-based reporting and visualization for business intelligence.
→
Human-in-the-Loop AI: Continuous feedback loop to improve AI model accuracy over time.
icons Product Matching icons Attribute Tagging icons Content Optimization icons Sentiment Analysis icons Prompt-Based Reporting

Connect the Dots Across
Your Retail Ecosystem

We partner with agencies, system integrators, and technology platforms to deliver end-to-end solutions across the retail and digital shelf ecosystem.

icons
Analytics Services
icons
Ad Tech
icons
Price Optimization
icons
Business Consulting
icons
System Integration
icons
Market Research
Become a Partner →

Popular Datasets — Ready to Download

Browse All Datasets →
icons
Amazon
eCommerce
Free 100 rows
icons
Zillow
Real Estate
Free 100 rows
icons
DoorDash
Food Delivery
Free 100 rows
icons
Walmart
Retail
Free 100 rows
icons
Booking.com
Travel
Free 100 rows
icons
Indeed
Jobs
Free 100 rows

Latest Insights & Resources

View All Resources →
thumb
Blog

Web Data RFP Checklist: How to Write an RFP for Web Data Collection (2026)

Use this web data RFP checklist to define scope, sources, fields, SLA, QA and pricing models, then score vendors fairly.

thumb
Case Study

How Sensitive Skin Skincare Product Data API Helps Brands Track Cleansers, Serums, Moisturizers, and Sunscreens

Sensitive Skin Skincare Product Data API helps brands track cleansers, serums, moisturizers, and sunscreens with structured product data.

thumb
Report

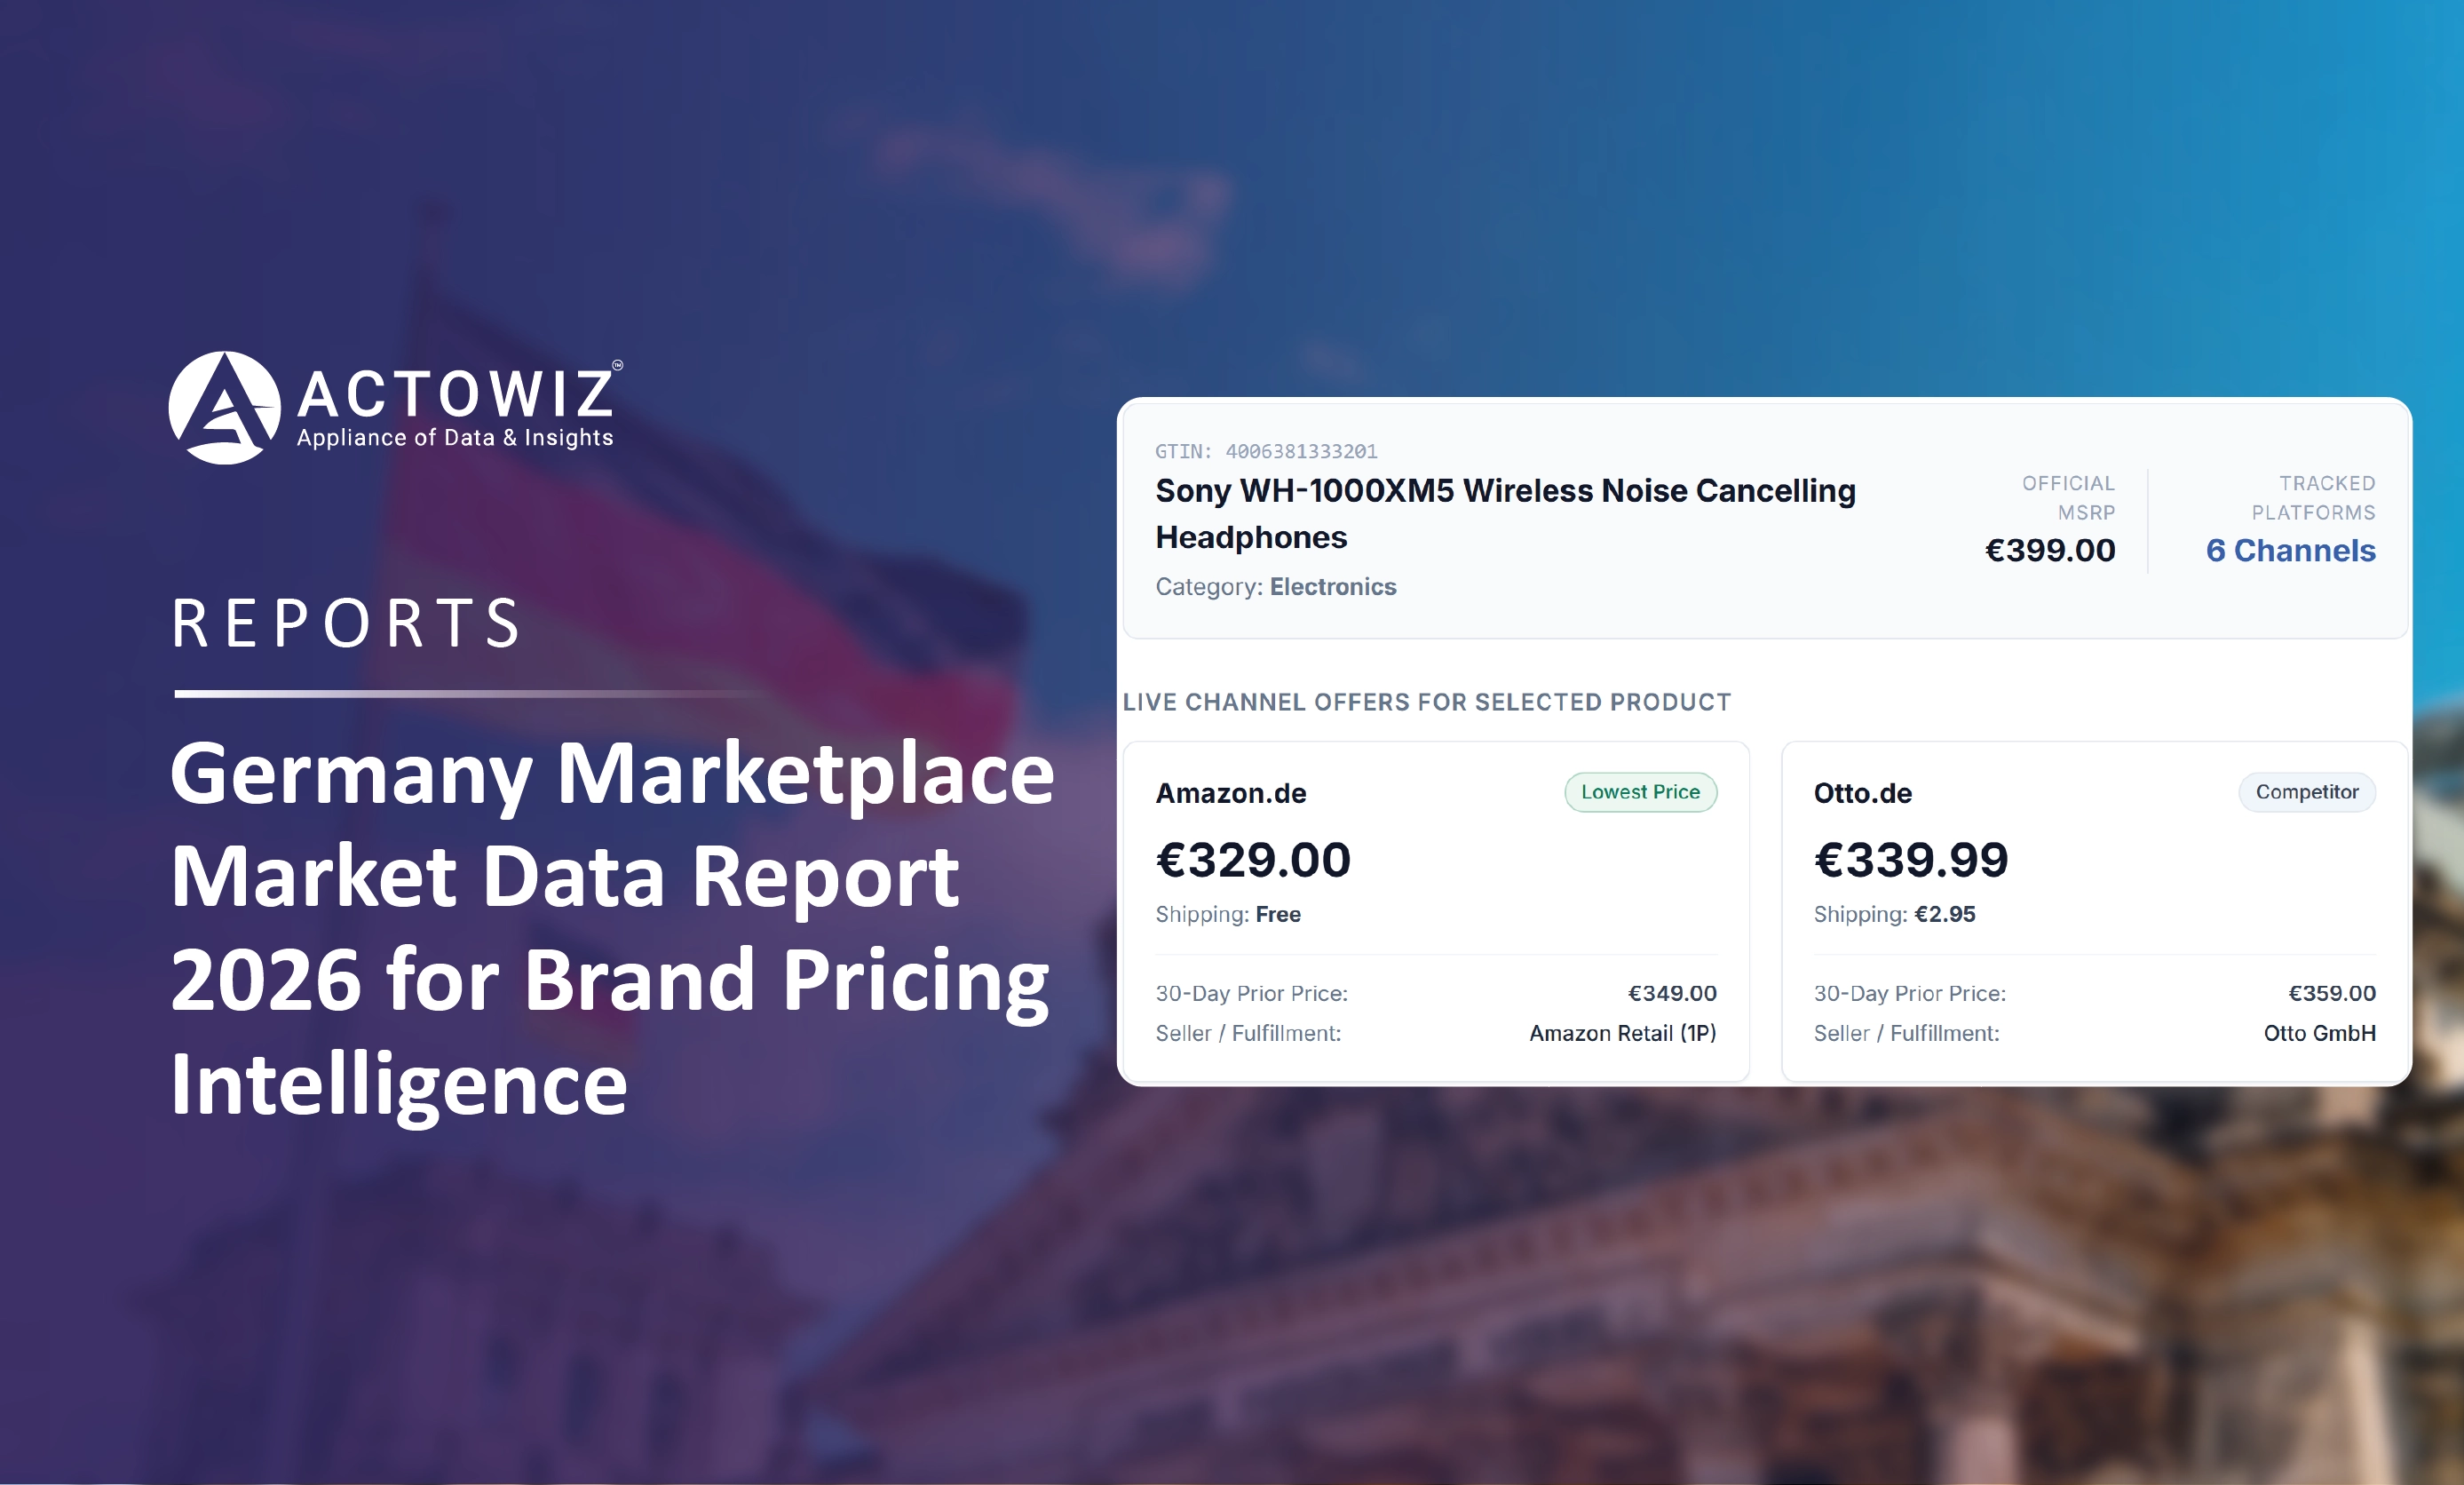
Germany Marketplace Market Data Report 2026 for Brand Pricing Intelligence

German marketplace data report 2026: online retail size, Amazon.de, Otto, Kaufland and Zalando price signals, PAngV rules and peak seasons.

Start Where It Makes Sense for You

Whether you're a startup or a Fortune 500 — we have the right plan for your data needs.

icons
Enterprise
Book a Strategy Call
Custom solutions, dedicated support, volume pricing for large-scale needs.
icons
Growing Brand
Get Free Sample Data
Try before you buy — 500 rows of real data, delivered in 2 hours. No strings.
icons
Just Exploring
View Plans & Pricing
Transparent plans from $500/mo. Find the right fit for your budget and scale.
Get in Touch
Let's Talk About
Your Data Needs
Tell us what data you need — we'll scope it for free and share a sample within hours.
  • icons
    Free Sample in 2 HoursShare your requirement, get 500 rows of real data — no commitment.
  • icons
    Plans from $500/monthFlexible pricing for startups, growing brands, and enterprises.
  • icons
    US-Based SupportOffices in New York & California. Aligned with your timezone.
  • icons
    ISO 9001 & 27001 CertifiedEnterprise-grade security and quality standards.
Request Free Sample Data
Fill the form below — our team will reach out within 2 hours.
+1 ▼
✓ Free 500-row sample · No credit card · Response within 2 hours

Request Free Sample Data

Our team will reach out within 2 hours with 500 rows of real data — no credit card required.

+1 ▼
✓ Free 500-row sample · No credit card · Response within 2 hours