Core services
Enterprise Data Extraction

Scalable web, app and AI-powered collection across 40+ countries.

All 58 services →
New 2026
AI Training Data

Corpus building with provenance and opt-out compliance.

Learn more →
Free pilot
24-hour sample

We run collection on your own sources before you commit.

Get a sample →
58Services
40+Countries
DEVELOPER

Ready-Made Scrapers

Pre-built for top platforms. Self-serve, no setup.

View All →
TRY FREE

API Playground

Test endpoints instantly. No credit card.

Start Free →
28Tools
2SDKs
icons Delivery & SDKs
Streaming Crawl API Scheduler Realtime Alerts Webhook Delivery 🐍 Python SDK 💚 Node.js SDK

Need it managed instead?

Fixed monthly retainer, named engineer, no per-request metering.

Managed Data API →
HOT

Case Studies

How brands use Actowiz, with named outcomes.

Read →
FREE

Sample Datasets

Real output, no signup.

Download →
NEW

ROI Calculator

Model the return on a data engagement.

Calculate →
Crex Data Scraping - Solving Accuracy and Data Consistency Issues in Cricket Analytics

Introduction

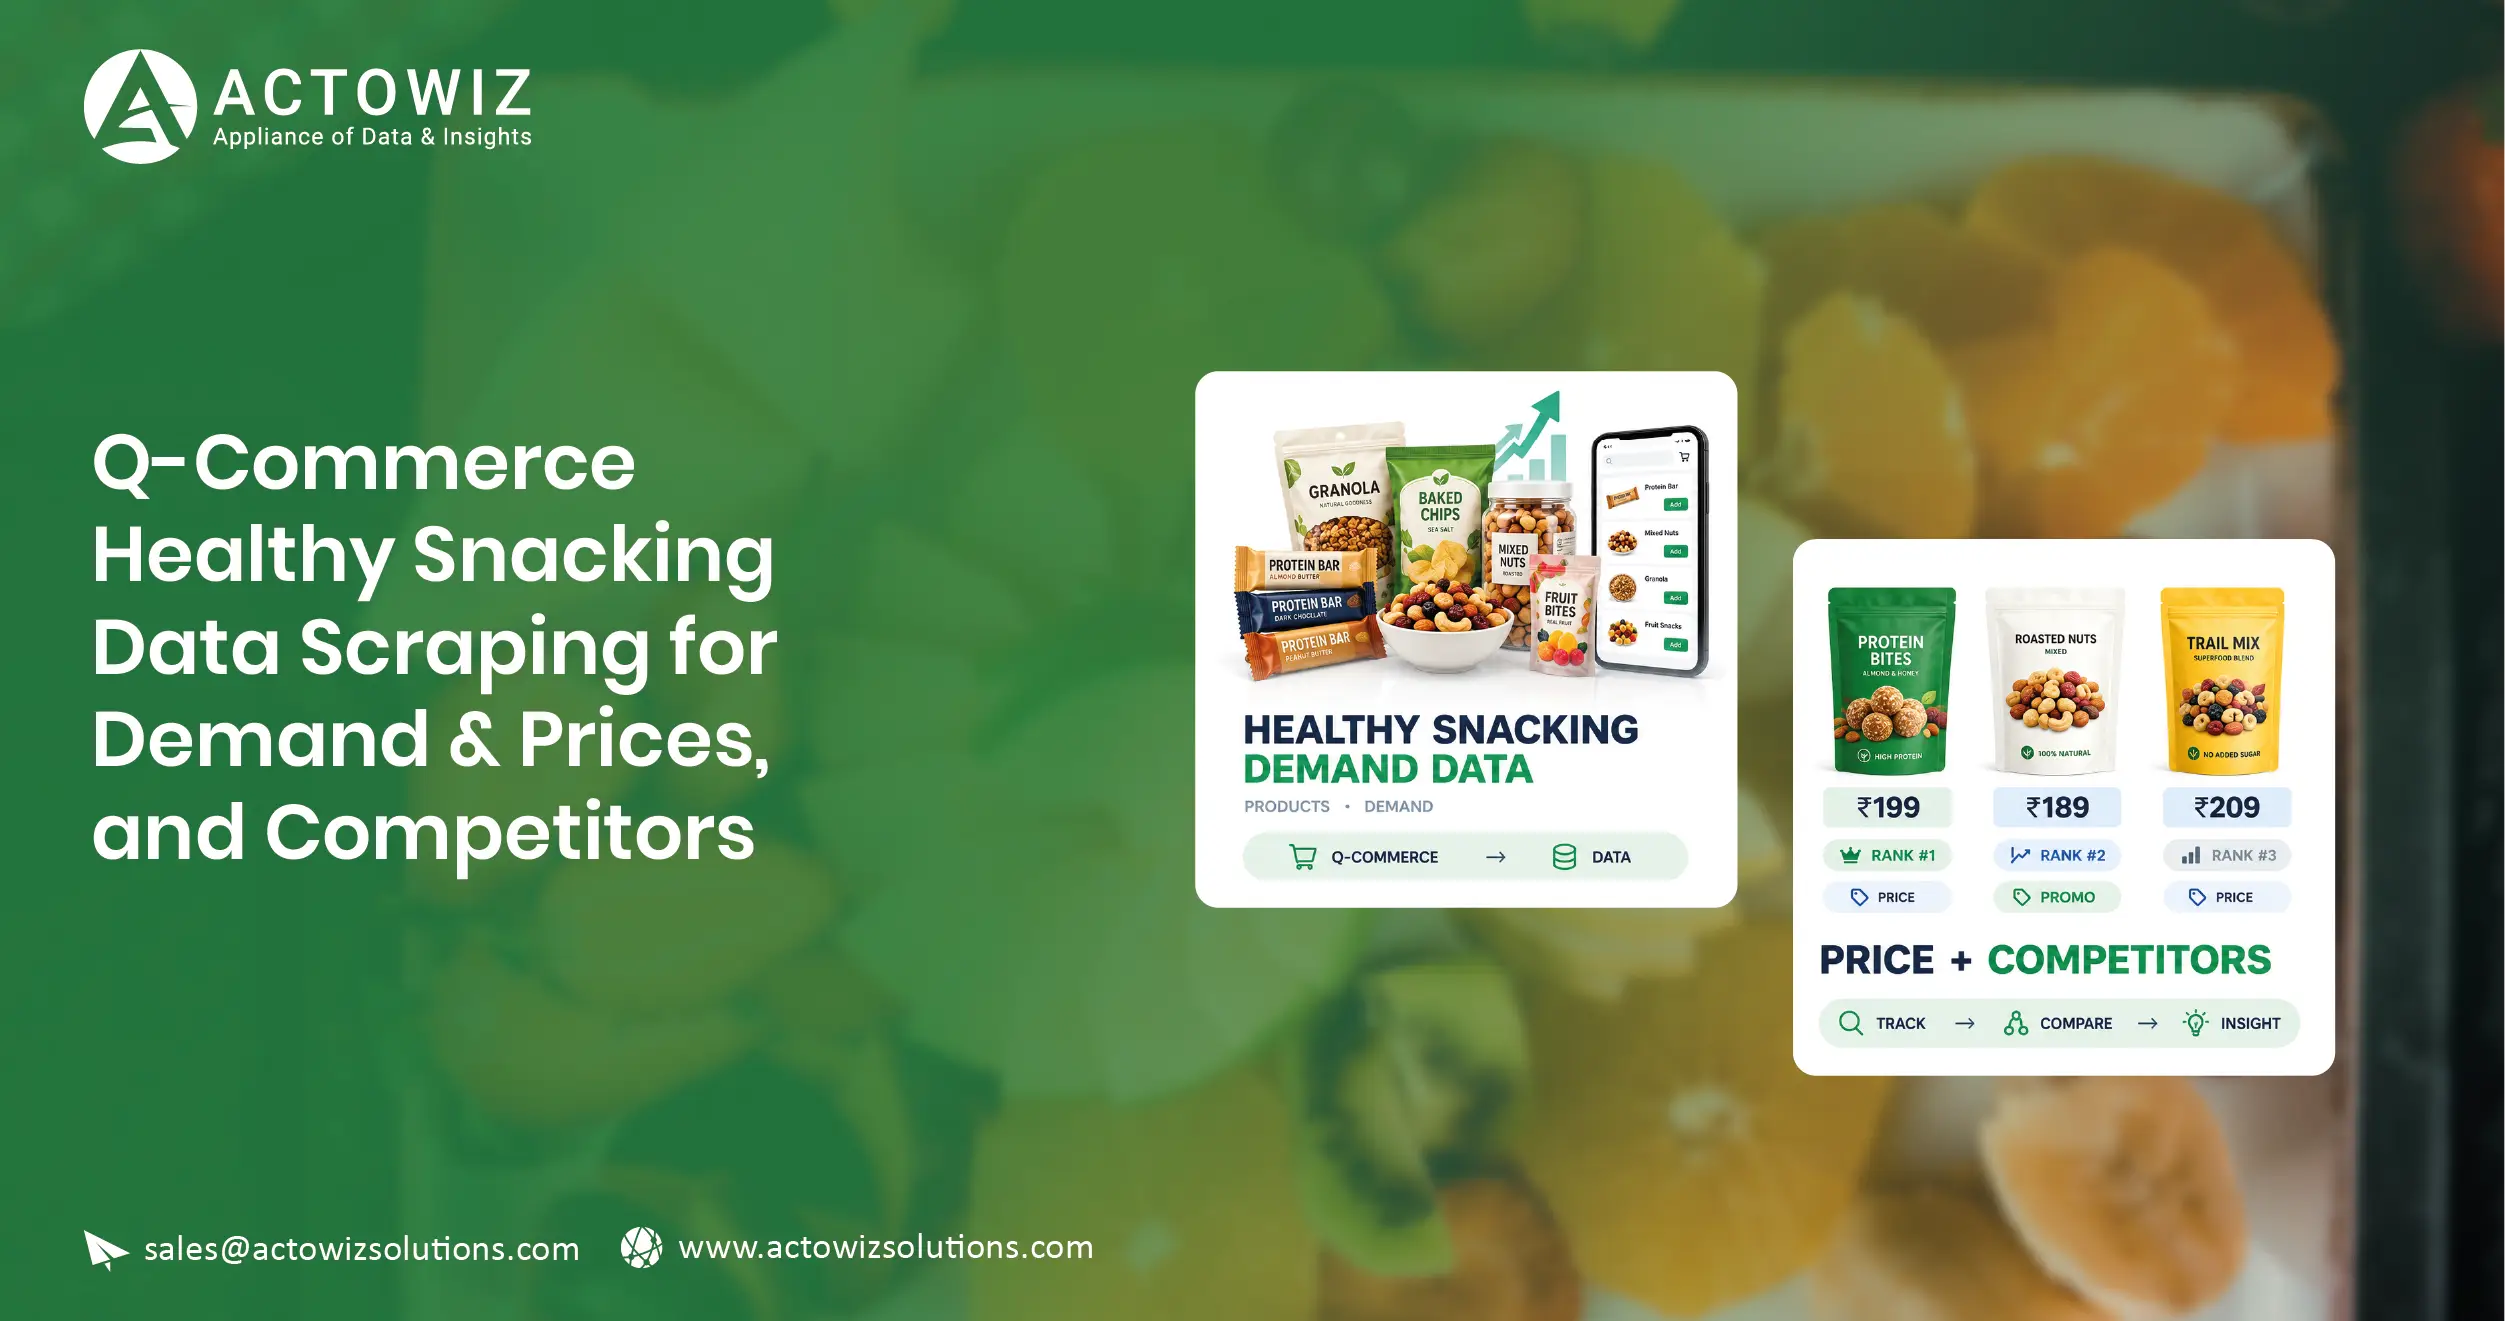
Brands can track healthy-snack demand, competitor pricing, product availability, assortment changes, and category movements more effectively by collecting structured marketplace data from quick-commerce platforms. Q-commerce Healthy snacking category data scraping gives FMCG and D2C brands a repeatable way to monitor products across fast-moving digital shelves, while Quick Commerce Data Scraping turns frequently changing marketplace information into analysis-ready datasets. This is increasingly important because Indian consumers are becoming more health-conscious while quick commerce is influencing how products are discovered and purchased. A 2025 consumer study reported that 72% of surveyed Indians actively sought functional benefits from snacks, while 55% prioritized preservative-free options. (Business Standard) For brands selling makhana, nuts, seeds, protein bars, roasted snacks, healthy beverages, and other better-for-you products, marketplace visibility is no longer limited to knowing whether a product is listed. Businesses need to understand price positioning, availability, promotions, assortment depth, and competitor movements at a granular level.

What Product-Level Visibility Can Reveal About Healthy Food Demand

Q-commerce Healthy Food product data extraction helps brands capture the detailed attributes needed to understand how healthy products are positioned across digital shelves. Instead of looking only at headline prices, brands can analyze product names, brands, pack sizes, categories, variants, discounts, ratings, availability, sellers, and other accessible attributes. This creates a structured view of the category that can support assortment planning and product benchmarking.

For a healthy-snack manufacturer, product-level data can answer practical questions: Which pack sizes are most common? Which brands dominate a category? Are protein-focused products expanding faster than conventional snacks? Are premium products receiving more shelf visibility? Which products disappear from specific locations? These signals can help commercial teams distinguish genuine demand patterns from isolated marketplace changes.

India's healthy snacks market was valued at USD 3.91 billion in 2024 and is projected to reach USD 6.12 billion by 2030, according to TechSci Research, with online identified as the fastest-growing sales channel. (Research and Markets) This makes digital shelf data particularly valuable for brands competing in online-first environments.

Metric Published/Forecast Value Business Meaning
India healthy snacks market, 2024 USD 3.91B Large and expanding category
Projected market, 2030 USD 6.12B Strong medium-term opportunity
Forecast CAGR 7.75% Sustained category growth
Fastest-growing channel Online Digital visibility matters

How the Market Changed from 2020 to 2026

Between 2020 and 2026, healthy snacking moved from a relatively niche wellness proposition toward a broader packaged-food opportunity. Earlier market research estimated India's healthy-snacks market at USD 2.91 billion in 2020 and USD 3.27 billion in 2022, with fruit-and-nut snacks among the major product groups. (WantStats) By 2024-2025, research increasingly highlighted health consciousness, convenience, online purchasing, and functional benefits as important growth drivers. In 2025, 72% of surveyed consumers said health influenced their snack choices, while dry fruits and roasted snacks remained highly preferred. (Business Standard) By 2026, quick commerce had become an increasingly important discovery and purchase channel, making product-level marketplace visibility more actionable for brands. The implication is clear: brands need historical and recurring datasets rather than one-time category snapshots. Comparing assortment, prices, availability, and promotional activity across years can reveal whether a trend represents temporary demand, seasonal behavior, or a structural shift.

How Can Brands Understand the Indian Quick-Commerce Assortment?

Brands looking to scraping healthy snack data from Indian q-commerce platforms can build a consistent view of products available across leading quick-commerce marketplaces and locations. This is particularly useful because the same product can have different prices, promotions, availability, pack sizes, or visibility depending on the platform and delivery location.

A structured collection process can capture product titles, brands, categories, pack sizes, MRP, selling price, discount percentage, availability, ratings, product URLs, and other accessible attributes. Once standardized, these fields can be compared across platforms and locations. Brands can identify assortment gaps, discover emerging competitors, and determine where their own products may have weak visibility.

The importance of such monitoring is reinforced by changing consumer expectations. Farmley's 2025 research found that 45% of consumers preferred on-the-go snack formats, while 55% prioritized preservative-free snacks. (The Economic Times) These preferences create multiple dimensions for assortment analysis, including pack format, ingredients, functional claims, and price.

Data Attribute What Brands Can Monitor
Product Brand, title, variant, pack size
Price MRP, selling price, discount
Availability In stock, unavailable, listing status
Category Snack type and subcategory
Positioning Protein, organic, low sugar, etc.
Competition Comparable products and brands

What Changed Between 2020 and 2026?

From 2020 to 2026, online grocery and quick-commerce shopping evolved from a convenience-led channel into an increasingly important route for product discovery. Healthy-snack brands gained opportunities to reach consumers beyond traditional supermarkets, while quick-commerce platforms created highly localized digital shelves. Earlier healthy-snack research already showed non-store channels growing faster than store-based channels in percentage terms. (WantStats) By 2025, consumer research was explicitly identifying quick commerce and influencers as drivers of impulse snacking. (The Economic Times) In 2026, the channel's commercial importance continued to increase; for example, Amazon's quick-commerce business in India reportedly crossed $1 billion in annualized sales based on the latest three-month period. (The Times of India) For brands, this evolution means assortment monitoring should account for platform, city, location, pack format, availability, and competitive density instead of treating e-commerce as a single national channel.

Why Does Market-Level Monitoring Matter for Healthy-Snack Brands?

India healthy snacking market data scraping can help businesses move beyond individual product tracking and understand the wider competitive structure of the category. Market-level datasets can be organized by brand, product type, price band, pack size, functional claim, category, platform, and geography.

This broader view is useful for brands planning launches or expanding their distribution. Suppose a company notices that protein bars are becoming more visible in metropolitan locations but that nuts and seeds dominate lower price bands. That information can influence product development, packaging, pricing, and promotional strategy. Similarly, if several competing brands introduce smaller packs, the change may indicate an opportunity to address affordability or impulse purchases.

Research also indicates that India's better-for-you snacks market is expanding. Grand View Research estimates revenue of USD 1.68 billion in 2024 and projects USD 2.88 billion by 2030, representing a 9.5% CAGR from 2025 to 2030. (Grand View Research)

Market Indicator Value
Better-for-you snacks revenue, 2024 USD 1.68B
Projected revenue, 2030 USD 2.88B
Forecast CAGR, 2025-2030 9.5%
Fast-growing product area Fruits, nuts & seeds

How Did Category Intelligence Evolve from 2020 to 2026?

The 2020-2026 period shows a transition from broad category estimates toward increasingly granular digital intelligence. In 2020, market analysis primarily focused on overall category size, conventional versus organic positioning, and traditional distribution channels. (WantStats) As online retail expanded, brands increasingly needed information about product-level availability and digital assortment. By 2024, India's healthy-snacks market had reached multiple billions of dollars according to different research methodologies, demonstrating the category's growing commercial significance. (Research and Markets) Consumer research in 2025 further showed that functional benefits, preservative-free positioning, convenient formats, and healthier ingredients were becoming meaningful purchase considerations. (Business Standard) By 2026, category intelligence therefore needs to connect consumer preferences with observable marketplace signals such as assortment changes, price movements, product availability, and promotional activity.

How Can Brands Compare Prices Across Quick-Commerce Platforms?

Brands can Scrape healthy snack prices across q-commerce platforms to understand their own price position against competing products. Pricing is especially important in a category where products can span affordable everyday snacks, premium nuts and seeds, protein products, functional foods, and specialized dietary offerings.

A recurring pricing dataset can capture MRP, current selling price, discount percentage, promotional price, pack size, and product availability. Normalizing these attributes allows businesses to calculate comparable price-per-unit or price-per-gram measures where pack sizes differ. This avoids misleading comparisons between a ₹100 small pack and a ₹250 larger pack.

Price monitoring can also reveal promotional intensity. A competitor offering 15% off every week may have a very different pricing strategy from one that provides occasional 25% discounts. Tracking these patterns over time helps brands distinguish regular pricing from campaign-led promotions.

Pricing Metric Example Use
MRP Understand listed price positioning
Selling price Compare actual marketplace price
Discount % Measure promotional intensity
Price per 100g Normalize different pack sizes
Price index Benchmark against competitors
Availability Connect price with stock status

What Pricing Signals Emerged Between 2020 and 2026?

From 2020 to 2026, digital pricing became increasingly dynamic as online competition intensified and quick commerce encouraged frequent promotional activity. Earlier healthy-snack markets were more dependent on traditional retail price visibility, whereas online channels made product-level price changes easier to observe. The growing online channel identified in market research reinforces the importance of digital price intelligence. (GII Research) Consumer demand also became more segmented, with health-conscious buyers looking for protein, natural ingredients, convenient formats, and functional benefits. In 2025, Farmley's consumer research reported strong interest in preservative-free products and on-the-go formats. (The Economic Times) By 2026, brands could no longer evaluate pricing only by comparing MRP. Effective monitoring increasingly requires understanding discounts, pack-size economics, competitor positioning, availability, and location-specific differences together.

How Can Brands Detect Emerging Category Trends Earlier?

Brands can Extract healthy snacking category trends across q-commerce by converting recurring marketplace observations into time-series intelligence. Instead of reviewing individual product pages, businesses can track how the category changes across weeks and months.

Trend analysis can reveal new brands entering the market, rising product claims, expanding pack-size formats, changing price bands, increasing promotional activity, and shifts in product availability. For example, a sudden increase in protein-focused snack listings may indicate stronger competitive interest in functional nutrition. A growing number of smaller packs may signal greater emphasis on affordability or impulse consumption.

This intelligence becomes particularly useful when combined with geographic monitoring. A product that performs strongly in Bengaluru may not have the same assortment or pricing pattern in Delhi, Mumbai, Hyderabad, or smaller cities. Location-level monitoring can therefore help brands localize their strategy rather than applying a single national assumption.

Trend Signal Possible Business Action
New brands appearing Evaluate competitive threat
More protein products Review product portfolio
Smaller packs increasing Consider affordable SKUs
Discount frequency rising Reassess price strategy
Availability declining Investigate supply issues
New claims appearing Explore product innovation

What Did 2020-2026 Teach Category Managers?

The biggest lesson from 2020-2026 is that healthy-snacking growth cannot be understood through market size alone. Consumer preferences became more specific, with interest in functional benefits, cleaner ingredients, convenience, and healthier formulations. NIQ reported that 84% of urban Indian respondents in its Consumer Life Study said they exercise daily or regularly to keep fit, while also highlighting demand for small, nutrient-rich formats and the growing role of online and quick commerce. (NIQ) Farmley's 2025 research similarly found that 72% of surveyed consumers actively sought functional benefits from snacks. (Business Standard) These developments mean brands need to monitor not only which products sell, but also which claims, pack formats, brands, and price points are gaining visibility. A recurring digital dataset can connect these signals and help category managers detect changes earlier.

How Can Data Collection Support a Scalable Competitive Strategy?

For large FMCG and D2C brands, Pricing & Product Data Scraping can connect product discovery, pricing intelligence, assortment monitoring, and competitor analysis into one recurring workflow. Q-commerce Healthy snacking category data scraping can then provide the category-specific layer required to monitor healthy-snack brands across platforms, locations, and product segments.

A scalable approach starts with defining the product universe. Brands can specify target categories, competitors, locations, attributes, platforms, and collection frequency. Data can then be collected, normalized, validated, deduplicated, and delivered in structured formats. Historical snapshots allow teams to compare today's marketplace against previous periods.

The value increases when raw data is transformed into business metrics. Examples include average selling price, median price, discount depth, price-per-gram, assortment count, competitor presence, availability rate, and product-level price index. These metrics can feed dashboards and analytical workflows.

Intelligence Layer Example Output
Product Assortment and SKU tracking
Pricing Price index and discount analysis
Availability Stock and listing monitoring
Competition Brand and SKU benchmarking
Geography City or location comparison
Trends Category growth signals

What Does the 2020-2026 Shift Mean for Data Strategy?

Between 2020 and 2026, the shift toward digital grocery and quick commerce increased the frequency with which product information could change. A static spreadsheet became less useful when products could be introduced, discounted, temporarily unavailable, or repositioned within short periods. At the same time, India's healthy-snack market continued to expand under multiple research estimates, with TechSci Research forecasting a rise from USD 3.91 billion in 2024 to USD 6.12 billion in 2030. (Research and Markets) The strategic requirement therefore shifted from simply collecting data to maintaining a repeatable data pipeline. Brands need historical snapshots, standardized fields, location-aware monitoring, and automated refreshes to distinguish short-term marketplace events from persistent trends. A well-designed pipeline can also support new competitors, categories, platforms, and geographic markets without requiring the business to rebuild its entire monitoring process.

How Can Actowiz Solutions Help?

Actowiz Solutions helps brands turn fragmented quick-commerce marketplace information into structured, analysis-ready intelligence. Its Healthy Snacking Category Intelligence approach can support product discovery, competitor monitoring, price benchmarking, assortment analysis, availability tracking, and category trend analysis across digital commerce environments.

A scalable Q-commerce Healthy snacking category data scraping workflow can be designed around the client's specific product universe and business questions. Data fields can include product name, SKU, brand, category, pack size, MRP, selling price, discount, availability, rating, seller information, product URL, and other accessible attributes.

The process can be adapted for recurring monitoring across selected locations and platforms. Automated collection reduces repetitive manual research, while normalization and validation improve comparability. Historical datasets can help brands identify price movements, assortment expansion, new product introductions, and changes in competitive positioning.

Actowiz Solutions can also support downstream data delivery for analytics teams. Structured outputs can be prepared for dashboards, databases, reporting systems, and internal business intelligence workflows. This enables product, pricing, marketing, category, and strategy teams to work from a consistent information base.

The approach is particularly valuable for brands that need scalable monitoring rather than one-time research. As the healthy-snacking category expands, businesses can add competitors, locations, product groups, and additional attributes without changing the overall intelligence framework.

Conclusion

Q-commerce Healthy snacking category data scraping gives brands a practical way to understand what is happening across a rapidly changing digital category. By tracking product assortment, prices, discounts, availability, competitors, and emerging trends, businesses can move from occasional marketplace checks to continuous category intelligence. India's healthy-snacks market is expanding, while consumer interest in functional benefits, healthier ingredients, and convenient formats is creating new opportunities for FMCG and D2C brands. (Research and Markets) Quick commerce adds another layer of complexity because digital shelves can vary by platform, location, time, and promotional cycle.

For organizations that need scalable collection and recurring monitoring, a combination of Web scraping API, Custom Datasets, and an instant data scraper can provide the infrastructure required to turn marketplace information into actionable intelligence. The result is better pricing visibility, stronger competitive benchmarking, improved assortment decisions, and faster identification of market opportunities.

You can also reach us for all your mobile app scraping, data collection, web scraping , and instant data scraper service requirements!

Social Proof That Converts

Trusted by Global Leaders Across Q-Commerce, Travel, Retail, and FoodTech

Our web scraping expertise is relied on by 4,000+ global enterprises including Zomato, Tata Consumer, Subway, and Expedia — helping them turn web data into growth.

4,000+ Enterprises Worldwide
50+ Countries Served
20+ Industries
Join 4,000+ companies growing with Actowiz →
Real Results from Real Clients

Hear It Directly from Our Clients

Watch how businesses like yours are using Actowiz data to drive growth.

▶
1 min
★★★★★
"Actowiz Solutions offered exceptional support with transparency and guidance throughout. Anna and Saga made the process easy for a non-technical user like me. Great service, fair pricing!"
TG
Thomas Galido
Co-Founder / Head of Product at Upright Data Inc.
▶
2 min
★★★★★
"Actowiz delivered impeccable results for our company. Their team ensured data accuracy and on-time delivery. The competitive intelligence completely transformed our pricing strategy."
II
Iulen Ibanez
CEO / Datacy.es
▶
1:30
★★★★★
"What impressed me most was the speed — we went from requirement to production data in under 48 hours. The API integration was seamless and the support team is always responsive."
FC
Febbin Chacko
-Fin, Small Business Owner
icons 4.8/5 Average Rating
icons 50+ Video Testimonials
icons 92% Client Retention
icons 50+ Countries Served

Join 4,000+ Companies Growing with Actowiz

From Zomato to Expedia — see why global leaders trust us with their data.

Why Global Leaders Trust Actowiz

Backed by automation, data volume, and enterprise-grade scale — we help businesses from startups to Fortune 500s extract competitive insights across the USA, UK, UAE, and beyond.

icons
7+
Years of Experience
Proven track record delivering enterprise-grade web scraping and data intelligence solutions.
icons
4,000+
Projects Delivered
Serving startups to Fortune 500 companies across 50+ countries worldwide.
icons
200+
In-House Experts
Dedicated engineers across scrapers, AI/ML models, APIs, and data quality assurance.
icons
9.2M
Automated Workflows
Running weekly across eCommerce, Quick Commerce, Travel, Real Estate, and Food industries.
icons
270+ TB
Data Transferred
Real-time and batch data scraping at massive scale, across industries globally.
icons
380M+
Pages Crawled Weekly
Scaled infrastructure for comprehensive global data coverage with 99% accuracy.

AI Solutions Engineered
for Your Needs

→
LLM-Powered Attribute Extraction: High-precision product matching using large language models for accurate data classification.
→
Advanced Computer Vision: Fine-grained object detection for precise product classification using text and image embeddings.
→
GPT-Based Analytics Layer: Natural language query-based reporting and visualization for business intelligence.
→
Human-in-the-Loop AI: Continuous feedback loop to improve AI model accuracy over time.
icons Product Matching icons Attribute Tagging icons Content Optimization icons Sentiment Analysis icons Prompt-Based Reporting

Connect the Dots Across
Your Retail Ecosystem

We partner with agencies, system integrators, and technology platforms to deliver end-to-end solutions across the retail and digital shelf ecosystem.

icons
Analytics Services
icons
Ad Tech
icons
Price Optimization
icons
Business Consulting
icons
System Integration
icons
Market Research
Become a Partner →

Popular Datasets — Ready to Download

Browse All Datasets →
icons
Amazon
eCommerce
Free 100 rows
icons
Zillow
Real Estate
Free 100 rows
icons
DoorDash
Food Delivery
Free 100 rows
icons
Walmart
Retail
Free 100 rows
icons
Booking.com
Travel
Free 100 rows
icons
Indeed
Jobs
Free 100 rows

Latest Insights & Resources

View All Resources →
thumb
Blog

Web Data RFP Checklist: How to Write an RFP for Web Data Collection (2026)

Use this web data RFP checklist to define scope, sources, fields, SLA, QA and pricing models, then score vendors fairly.

thumb
Case Study

How Sensitive Skin Skincare Product Data API Helps Brands Track Cleansers, Serums, Moisturizers, and Sunscreens

Sensitive Skin Skincare Product Data API helps brands track cleansers, serums, moisturizers, and sunscreens with structured product data.

thumb
Report

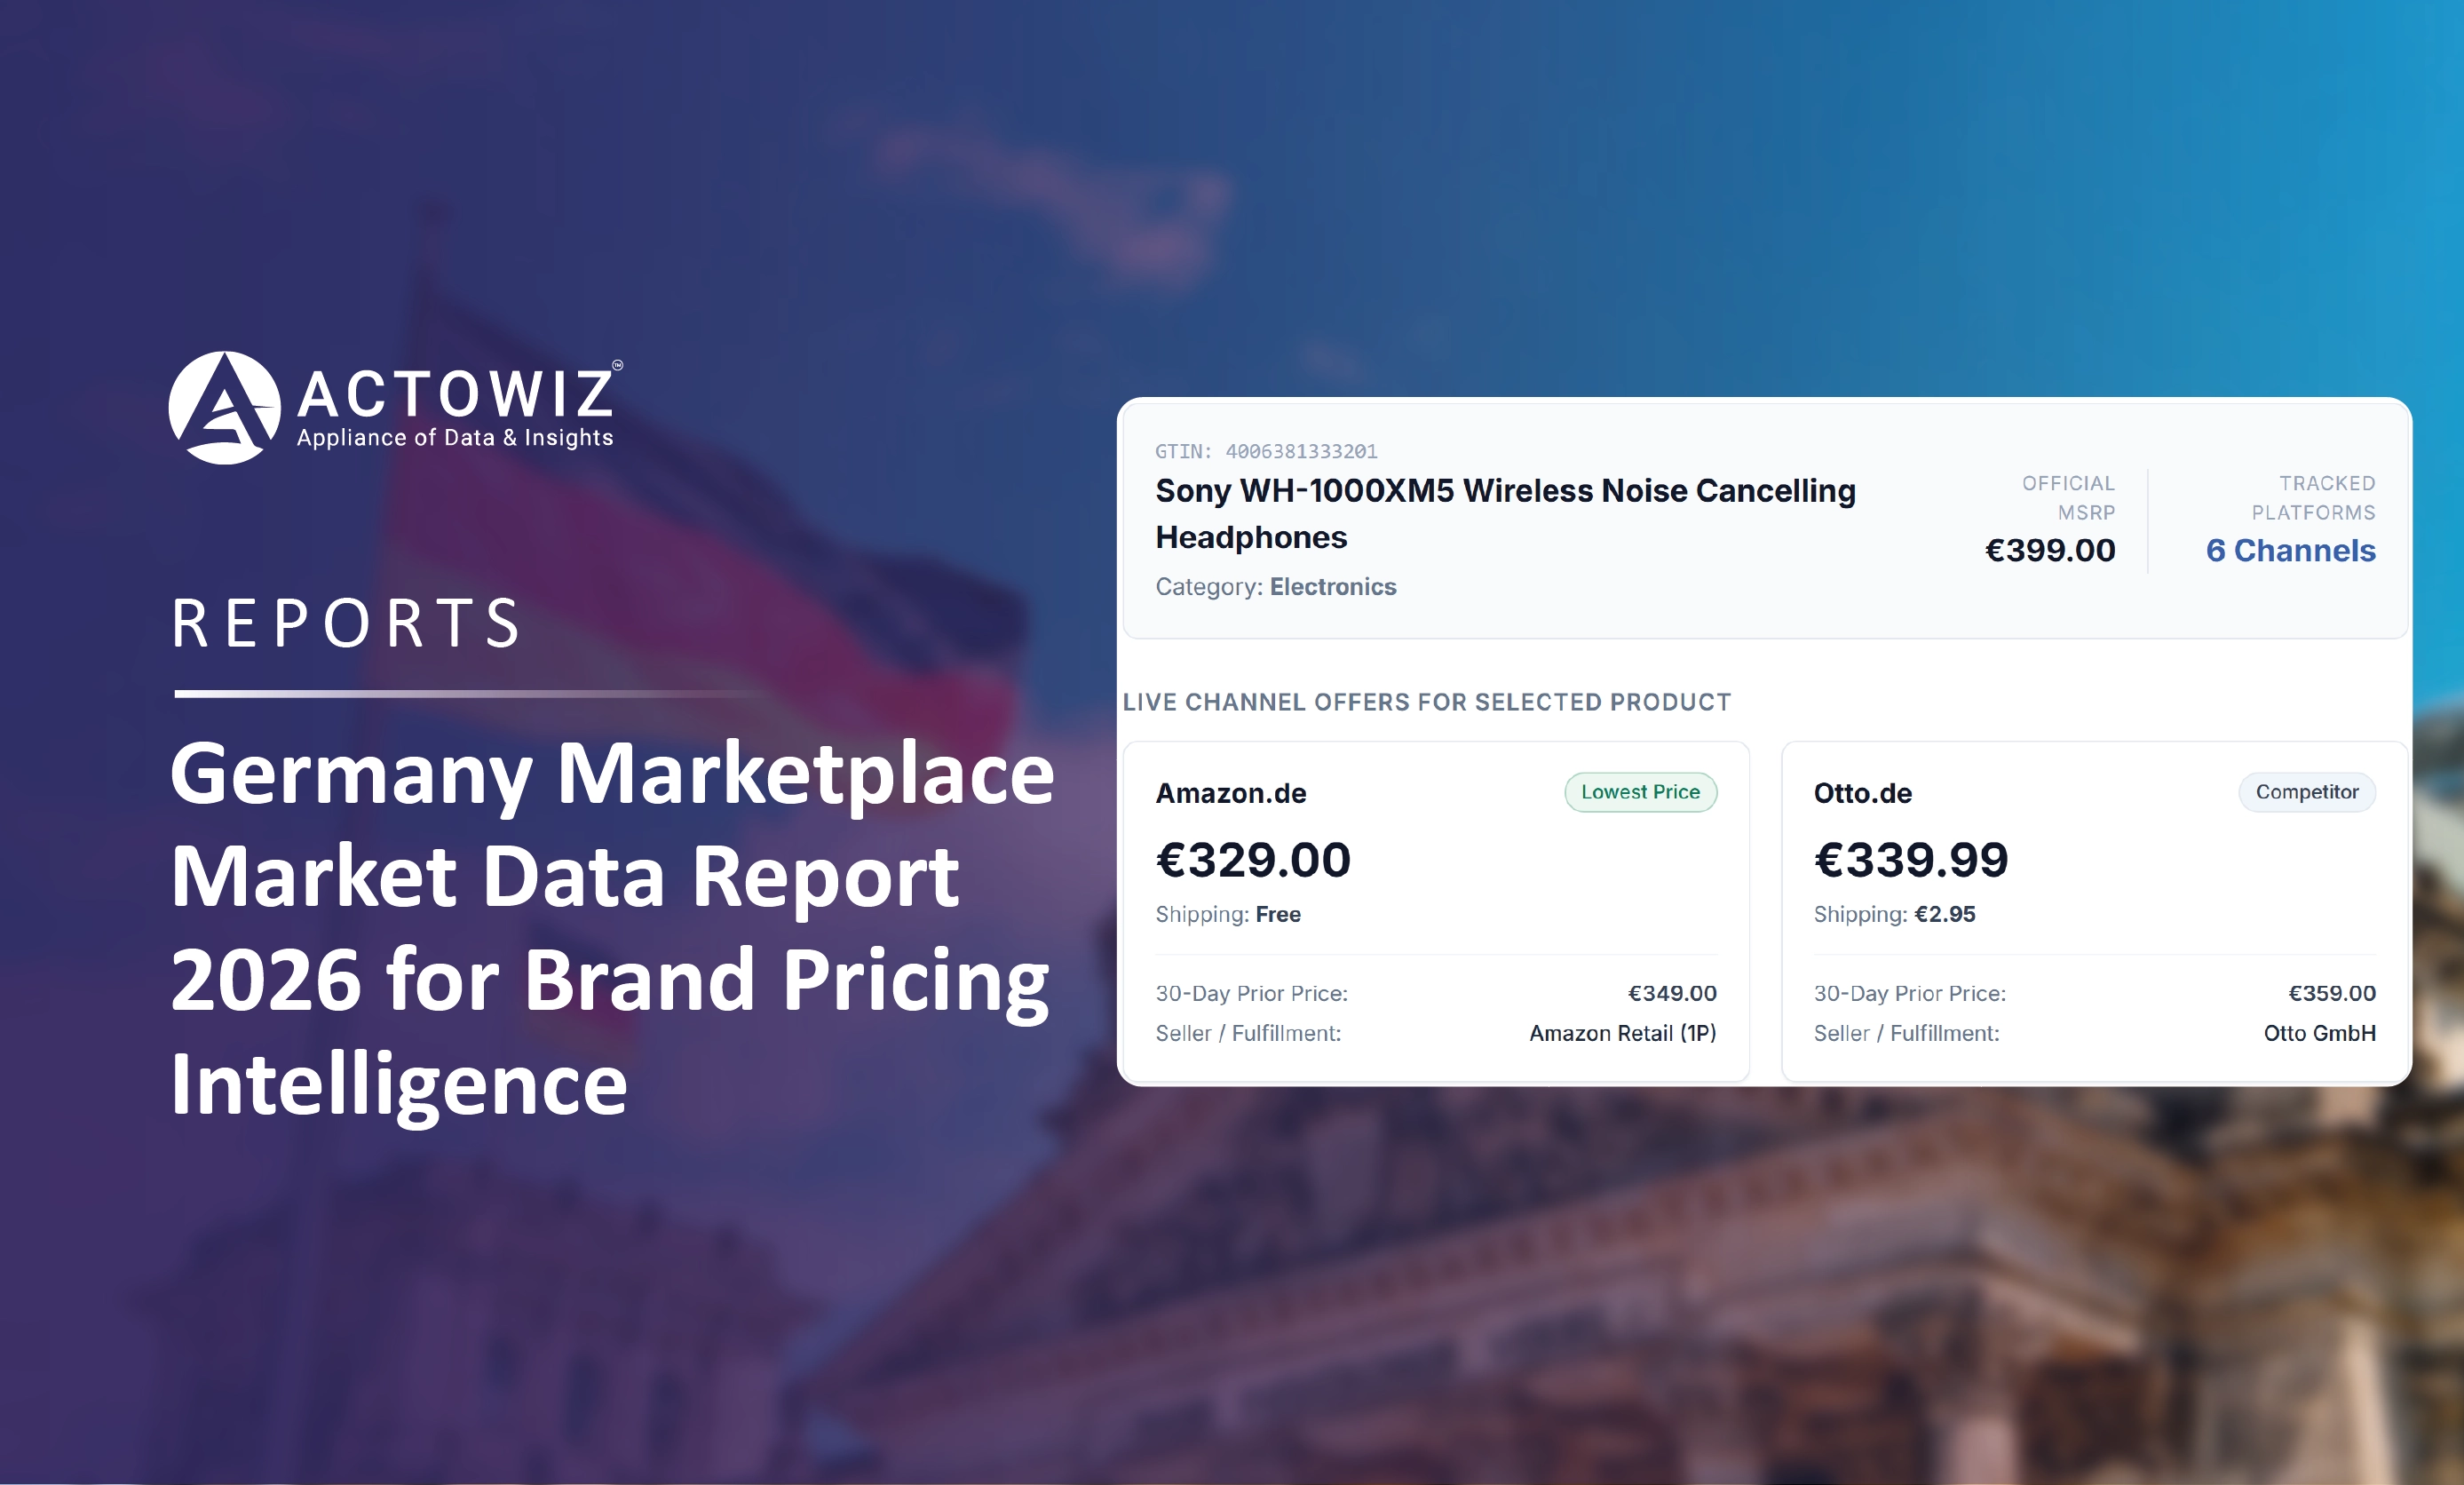
Germany Marketplace Market Data Report 2026 for Brand Pricing Intelligence

German marketplace data report 2026: online retail size, Amazon.de, Otto, Kaufland and Zalando price signals, PAngV rules and peak seasons.

Start Where It Makes Sense for You

Whether you're a startup or a Fortune 500 — we have the right plan for your data needs.

icons
Enterprise
Book a Strategy Call

Custom solutions, dedicated support, volume pricing for large-scale needs.
icons
Growing Brand
Get Free Sample Data
Try before you buy — 500 rows of real data, delivered in 2 hours. No strings.
icons
Just Exploring
View Plans & Pricing
Transparent plans from $500/mo. Find the right fit for your budget and scale.
Get in Touch
Let's Talk About
Your Data Needs
Tell us what data you need — we'll scope it for free and share a sample within hours.
  • icons
    Free Sample in 2 HoursShare your requirement, get 500 rows of real data — no commitment.
  • icons
    Plans from $500/monthFlexible pricing for startups, growing brands, and enterprises.
  • icons
    US-Based SupportOffices in New York & California. Aligned with your timezone.
  • icons
    ISO 9001 & 27001 CertifiedEnterprise-grade security and quality standards.
Request Free Sample Data
Fill the form below — our team will reach out within 2 hours.
+1 ▼
✓ Free 500-row sample · No credit card · Response within 2 hours

Request Free Sample Data

Our team will reach out within 2 hours with 500 rows of real data — no credit card required.

+1 ▼
✓ Free 500-row sample · No credit card · Response within 2 hours