Introduction
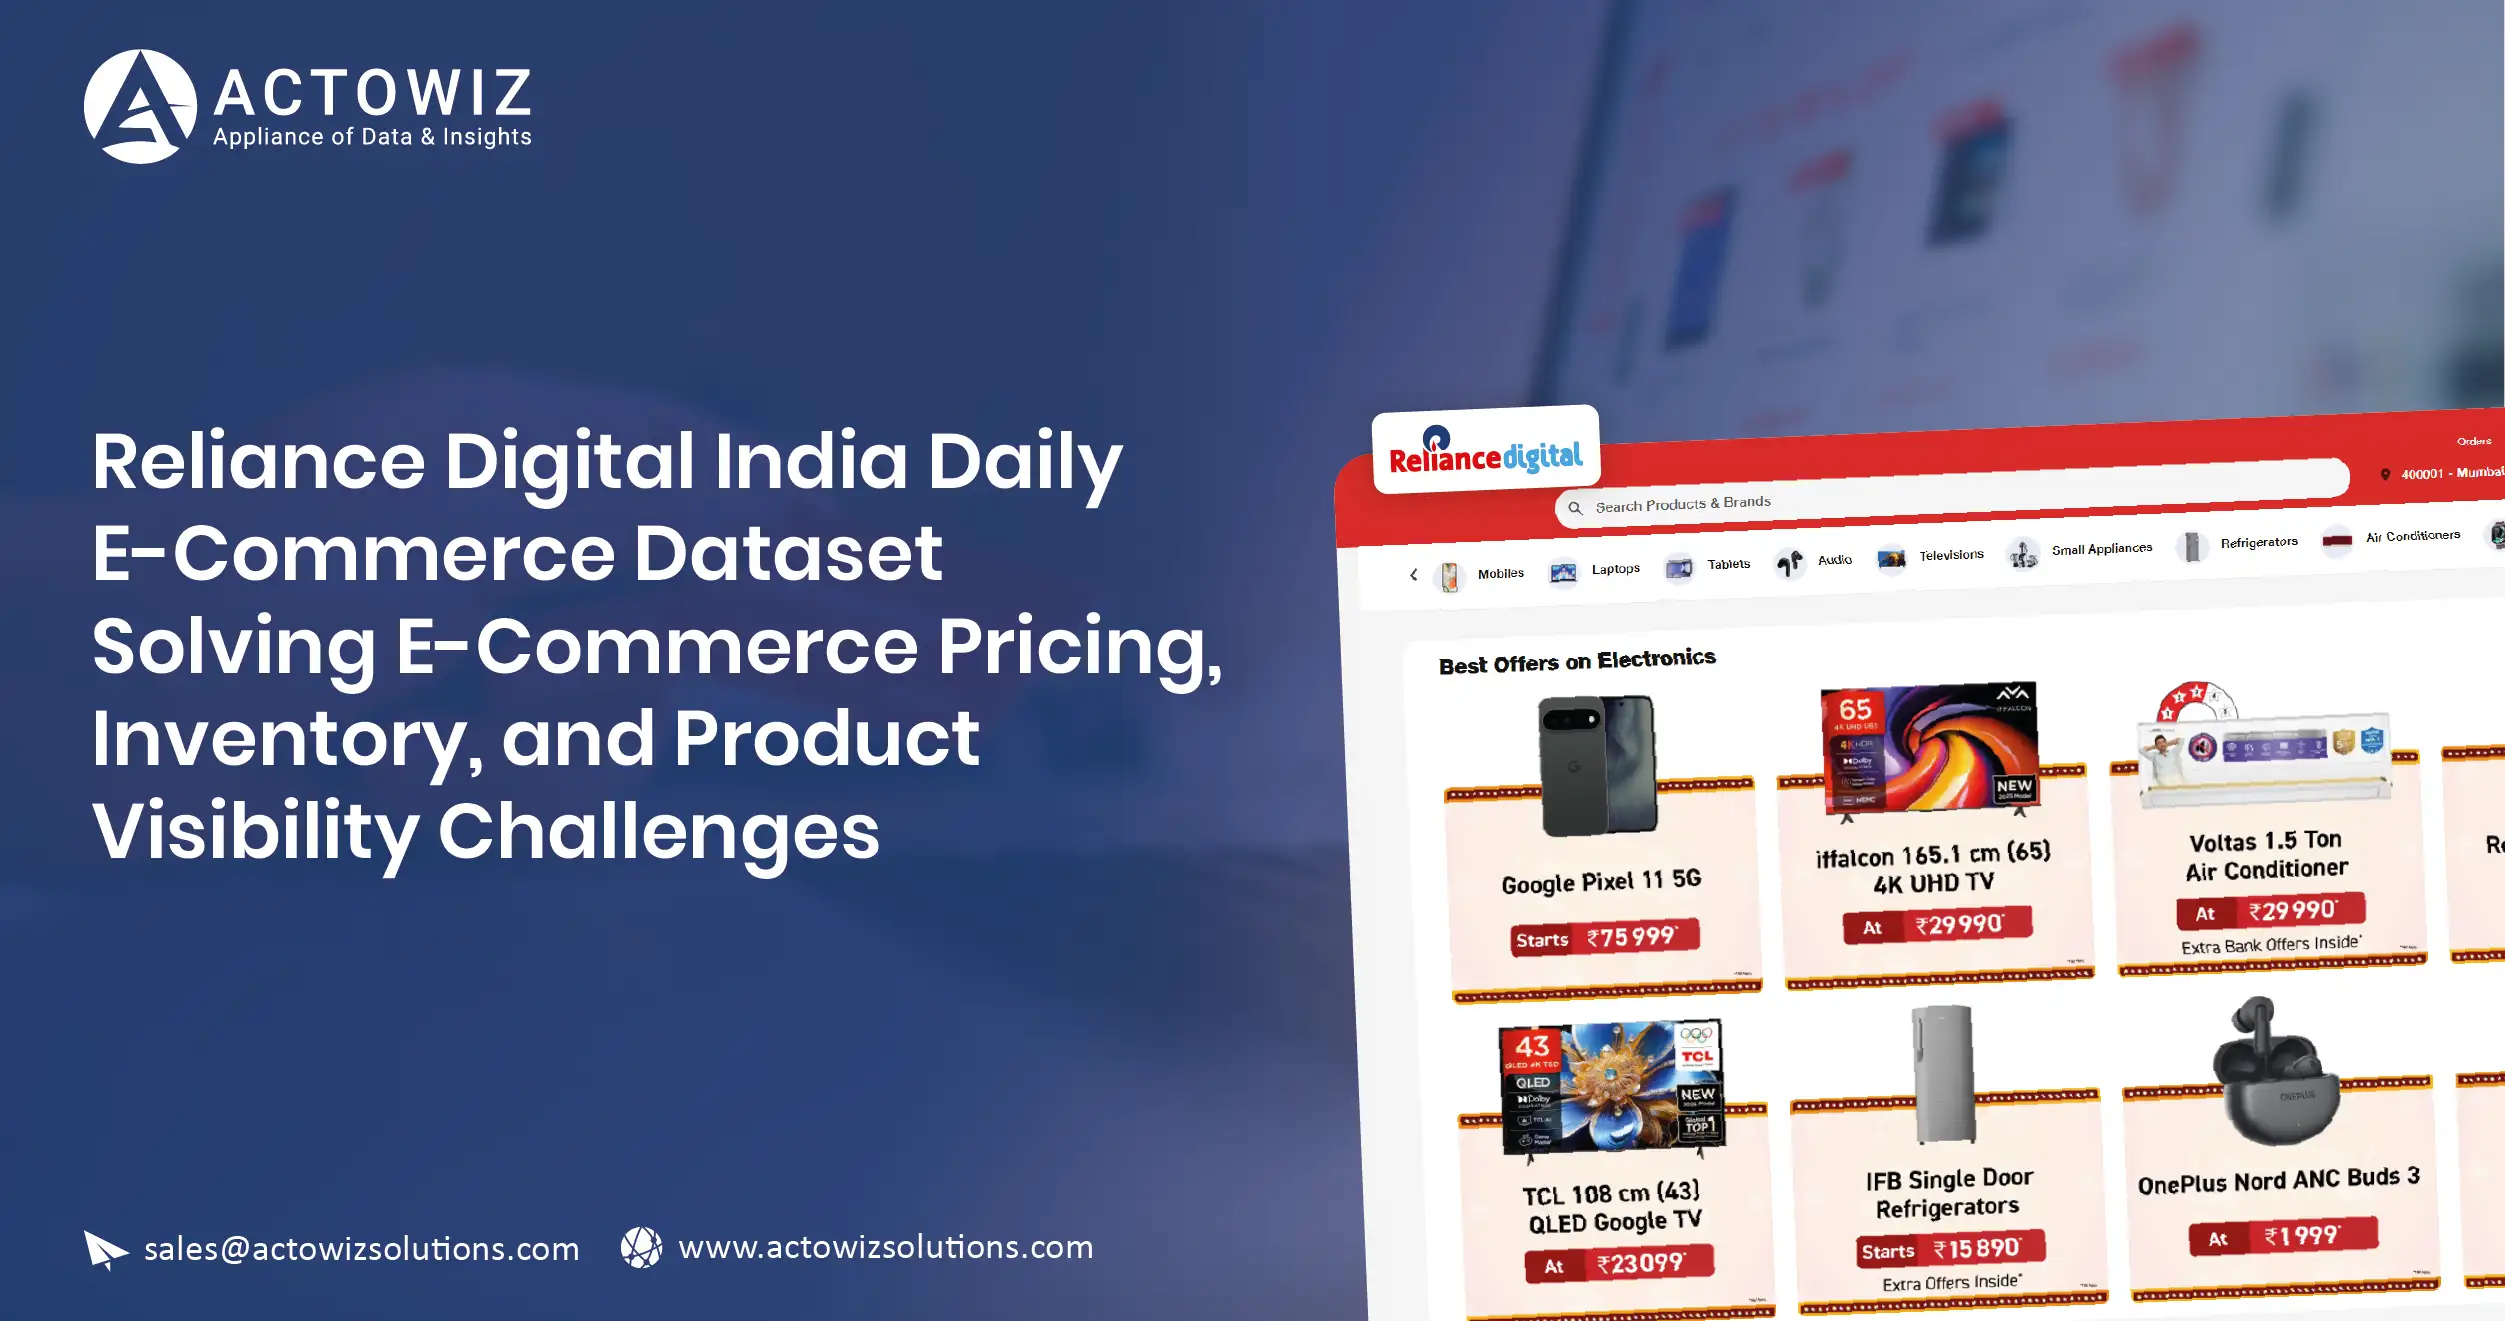
Reliance Digital India Daily E-Commerce Dataset enables brands, retailers, manufacturers, and market intelligence teams to address one of the biggest challenges in electronics e-commerce: continuously understanding how products, prices, specifications, and availability change online. For businesses competing in consumer electronics, daily product-level visibility can support pricing decisions, assortment monitoring, competitor benchmarking, and inventory analysis.
The need for structured retail intelligence is significant because Reliance Retail operates at considerable scale. In FY2025-26, Reliance Retail reported gross revenue of ₹3,71,085 crore, 387 million registered customers, more than 1.9 billion transactions, and 20,160 stores. Its consumer electronics business includes Reliance Digital and MyJio Stores. Reliance Industries Limited
For organizations seeking to understand this environment, Reliance Digital Data Scraping can convert publicly visible product information into structured datasets covering product names, brands, prices, discounts, specifications, images, ratings where available, and availability indicators.
The central business question is straightforward: How can companies solve pricing, inventory, and product-visibility challenges in a rapidly changing electronics market? The answer is continuous, structured, SKU-level monitoring rather than occasional manual checks.
What Does the Market Scale Tell Us About the Need for Better Retail Data?
Reliance Retail's reported growth demonstrates why retail intelligence needs to operate at scale. Its retail revenue increased from ₹1,53,818 crore in FY2020-21 to ₹3,71,085 crore in FY2025-26. Over the same period, its reported store footprint expanded substantially, while its registered customer base increased from 156 million to 387 million. Reliance Industries Limited
Reliance Retail's reported scale, 2020-21 to 2025-26
| Financial year |
Retail revenue / gross revenue |
Retail stores |
Registered customers |
| FY2020-21 |
₹1,53,818 crore |
12,711 |
156 million |
| FY2021-22 |
₹1,99,749 crore |
15,196 |
193 million |
| FY2022-23 |
₹2,60,394 crore |
18,040 |
249 million |
| FY2023-24 |
₹3,06,848 crore |
18,836 |
300 million+ |
| FY2024-25 |
₹3,30,943 crore |
19,340 |
349 million |
| FY2025-26 |
₹3,71,085 crore |
20,160 |
387 million |
Sources: Reliance Industries annual reports and FY2025-26 retail reporting. Figures refer to Reliance Retail rather than Reliance Digital alone, because Reliance does not publicly disclose all requested Digital-only metrics in a consistent annual series. Reliance Industries Limited
This scale creates a practical data challenge for brands. Product portfolios change, prices move, promotions appear and disappear, and availability can vary. A weekly or monthly snapshot can miss important changes.
For pricing teams, this means historical snapshots matter. For category managers, assortment history matters. For inventory teams, availability signals matter. For manufacturers, competitor positioning matters.
A daily dataset creates a consistent observation layer that can be compared over time.
How Can Product-Level Price Intelligence Improve Competitive Decisions?
The Reliance Digital Electronics Product Price Dataset can be structured around SKU-level attributes such as product title, brand, model number, selling price, MRP, discount, category, product URL, and collection date. This structure allows businesses to compare the same product across different dates rather than relying on a single price observation.
The Reliance Digital India Daily E-Commerce Data can further support historical analysis by maintaining recurring snapshots. For example, a pricing team can identify whether a product's listed price changed before a promotional event, whether a discount remained active, or whether a particular model repeatedly appeared at a lower price.
This is particularly relevant in consumer electronics because products have distinct model numbers and specifications. A comparison based only on product titles can create false matches. Model identifiers, storage capacity, RAM, screen size, processor, colour, and other specifications help establish product-level identity.
Reliance Retail itself reported that consumer electronics performance in FY2025-26 was supported by festive campaigns, new product launches, and broad-based growth led by laptops, mobiles, and TVs. The company's Digital India Sale recorded 30% year-on-year sales growth, while JioMart Digital continued to see growth led by TV and IT categories. Reliance Industries Limited
What the reported numbers indicate
| Metric |
Reported figure |
Period |
| Reliance Retail gross revenue |
₹3,71,085 crore |
FY2025-26 |
| Consumer electronics Digital India Sale growth |
30% YoY |
FY2025-26 |
| Retail transactions |
1.9 billion+ |
FY2025-26 |
| Registered customers |
387 million |
FY2025-26 |
For a brand manager, the practical value is not simply knowing today's price. It is knowing how today's price compares with the product's historical price and the competitive pricing environment.
A structured dataset can therefore support:
- Price-change detection
- Discount monitoring
- MRP versus selling-price comparison
- Promotional-period analysis
- SKU-level historical benchmarking
- Brand-level price positioning
- Category-level price movement analysis
The result is a more defensible pricing strategy based on observed market data rather than periodic manual checks.
How Can Product Content Monitoring Improve Online Visibility?
The Reliance Digital Products Image & Specification Data Collection process can help brands monitor how their products are represented on a major electronics retail channel. Product content can include titles, images, technical specifications, feature descriptions, model numbers, category information, and other publicly displayed attributes.
This matters because product visibility depends on more than price. A product may be competitively priced but still underperform if important specifications are missing, inconsistent, outdated, or presented differently from competing products.
An E-Commerce Dashboard can consolidate these observations into a monitoring environment where business teams can track changes without manually opening individual product pages.
For manufacturers and distributors, content monitoring can help answer questions such as:
- Is the correct model number displayed?
- Are important specifications visible?
- Has the product image changed?
- Are technical attributes consistent?
- Is the product positioned in the appropriate category?
- Has product content changed after a new launch?
- Which products have incomplete or changed information?
Reliance Retail's consumer electronics business operates Reliance Digital and MyJio Stores and offers consumer electronics, home appliances, computing, mobility products, gadgets, and accessories. Reliance Retail
That breadth makes content normalization important for businesses monitoring multiple product families.
A practical monitoring framework
| Data layer |
Business question |
Action |
| Product identity |
Is the correct SKU being monitored? |
Match model/SKU identifiers |
| Product title |
Is naming consistent? |
Compare title changes |
| Images |
Is current imagery displayed? |
Detect image updates |
| Specifications |
Are key attributes complete? |
Identify missing fields |
| Category |
Is classification accurate? |
Monitor category placement |
| Price |
Is pricing competitive? |
Track historical movement |
| Availability |
Can customers currently purchase? |
Monitor availability signals |
The goal is not to collect information for its own sake. The goal is to create a reliable product intelligence layer that merchandising, category, sales, and marketing teams can use.
How Can Daily Price Monitoring Reveal Competitive Movements?
Reliance Digital Electronics Pricing Data Scraping can provide the foundation for monitoring price movements across electronics categories. The important distinction is between a one-time price scrape and recurring data collection.
A single observation answers: What is the price now?
A recurring dataset can answer:
- When did the price change?
- How frequently did it change?
- Was the change associated with a promotional period?
- Which products experienced the largest movements?
- How did competing products move during the same period?
- Which brands maintained premium pricing?
This distinction is important for consumer electronics because pricing can change around product launches, promotional campaigns, festive periods, inventory cycles, and model transitions.
Reliance's reported retail performance demonstrates the scale of promotional activity. In FY2025-26, the company stated that the Digital India Sale delivered 30% year-on-year sales growth, while consumer electronics stores benefited from festive campaigns and new product launches. Reliance Industries Limited
Reported historical retail growth
| Financial year |
Reliance Retail gross revenue |
YoY growth |
| FY2020-21 |
₹1,53,818 crore |
5.6% |
| FY2021-22 |
₹1,99,749 crore |
26.7% |
| FY2022-23 |
₹2,60,394 crore |
30.4% |
| FY2023-24 |
₹3,06,848 crore |
17.8% |
| FY2024-25 |
₹3,30,943 crore |
7.9% |
| FY2025-26 |
₹3,71,085 crore |
12.1% |
These are Reliance Retail-level figures and should not be interpreted as Reliance Digital website revenue. However, they demonstrate the expanding scale of the wider retail environment in which consumer electronics operates.
For a pricing analyst, daily observations can be transformed into indicators such as price-change frequency, discount depth, price volatility, lowest observed price, average observed price, and promotional duration.
This creates a historical evidence base for pricing decisions.
How Can SKU-Level Monitoring Reduce Product Blind Spots?
A Reliance Digital daily SKU-level e-commerce dataset provides a more granular approach to product intelligence. Instead of tracking categories only, businesses can maintain a historical record for individual products.
The Reliance Digital India Daily E-Commerce Dataset can be organized so that every observation contains a collection date and product identifier. This makes it possible to reconstruct how a product's online presence changed over time.
For example, a SKU record can contain:
| Field |
Purpose |
| SKU/model number |
Product identification |
| Product name |
Search and reporting |
| Brand |
Brand-level analysis |
| Category |
Assortment analysis |
| Selling price |
Price tracking |
| MRP |
Discount calculation |
| Discount |
Promotional analysis |
| Availability status |
Inventory visibility |
| Product URL |
Source reference |
| Image URL |
Content monitoring |
| Specifications |
Product comparison |
| Collection timestamp |
Historical analysis |
Reliance Retail's reported expansion illustrates why SKU-level tracking becomes more relevant as retail scale grows. The company increased its store count from 12,711 in FY2020-21 to 20,160 in FY2025-26, while its registered customer base rose from 156 million to 387 million. Reliance Industries Limited
For electronics brands, a growing retail ecosystem means more products, categories, launches, replacements, and promotional cycles to monitor.
A SKU-level historical dataset can help teams identify:
New product entries: Detect newly appearing models.
Discontinued products: Identify products that disappear from active listings.
Price transitions: Observe changes during a product lifecycle.
Assortment changes: Track category expansion or contraction.
Content changes: Detect updated specifications and imagery.
Availability patterns: Identify repeated periods when products become unavailable.
The key benefit is traceability. When a business needs to understand why a product's market position changed, historical records provide evidence.
How Can Inventory and Availability Signals Improve Planning?
Daily Reliance Digital inventory and availability data Extraction can help businesses monitor whether products appear available, unavailable, out of stock, or otherwise restricted for purchase based on publicly visible signals.
Inventory intelligence should not be confused with access to Reliance's internal warehouse inventory. Public e-commerce collection can capture online availability signals, not proprietary internal stock levels.
That distinction is critical for responsible data interpretation.
For an electronics manufacturer, repeated online unavailability can be commercially relevant. It may indicate strong demand, supply constraints, catalogue changes, regional availability differences, or a temporary listing issue. Without historical observations, it is difficult to distinguish a one-day event from a recurring pattern.
Reliance Retail reported significant investments in supply-chain infrastructure as its retail network expanded. In FY2022-23, the company added 12.6 million square feet of warehouse space while expanding its store network to 18,040 stores. Reliance Industries Limited
By FY2025-26, Reliance Retail reported more than 1.9 billion customer transactions and 20,160 stores. Reliance Industries Limited
Availability monitoring can support
| Business function |
Data signal |
Potential decision |
| Inventory planning |
Availability changes |
Investigate replenishment needs |
| Sales |
Product visibility |
Identify potentially lost sales opportunities |
| Category management |
SKU presence |
Review assortment |
| Marketing |
Product availability |
Avoid promoting unavailable products |
| Brand management |
Listing status |
Escalate catalogue issues |
| Competitive intelligence |
Competitor availability |
Evaluate market opportunity |
The most useful approach is to combine availability with price, product identity, and timestamp data.
That allows businesses to move from a simple in-stock/out-of-stock view toward historical availability intelligence.
How Can an API Turn Retail Data Into Usable Intelligence?
A Reliance Digital India Electronics pricing intelligence API can make collected product information easier for internal applications, analytics systems, dashboards, and automated workflows to consume.
The objective is not merely API access. The objective is consistent, structured delivery.
A pricing intelligence pipeline can connect collection, validation, normalization, storage, analytics, and visualization.
For example:
Source → Data collection → Validation → SKU matching → Historical storage → Analytics → Dashboard → Business action
This architecture is especially useful for organizations managing large product catalogues.
Reliance Retail's reported FY2025-26 performance shows the scale of the broader ecosystem: ₹3,71,085 crore gross revenue, 20,160 stores, 387 million registered customers, and more than 1.9 billion transactions. Reliance Industries Limited
The larger the retail environment, the less practical it becomes to rely exclusively on manual monitoring.
Historical scale demonstrates the data challenge
| Year |
Stores |
Registered customers |
Reported retail revenue |
| FY2020-21 |
12,711 |
156 million |
₹1,53,818 crore |
| FY2021-22 |
15,196 |
193 million |
₹1,99,749 crore |
| FY2022-23 |
18,040 |
249 million |
₹2,60,394 crore |
| FY2023-24 |
18,836 |
300 million+ |
₹3,06,848 crore |
| FY2024-25 |
19,340 |
349 million |
₹3,30,943 crore |
| FY2025-26 |
20,160 |
387 million |
₹3,71,085 crore |
For businesses building pricing or assortment intelligence, an API-based delivery model can help integrate structured observations with BI platforms, internal databases, pricing engines, competitor-monitoring systems, and reporting workflows.
How Can Actowiz Solutions Help?
Actowiz Solutions can help businesses design structured e-commerce data pipelines around product, pricing, availability, specification, and assortment requirements.
With Extract Reliance Digital API, businesses can explore an automated approach to collecting and structuring publicly available product information according to their defined requirements.
The Reliance Digital India Daily E-Commerce Dataset can be designed around the fields that matter to the business rather than providing a generic one-size-fits-all extract.
What can a tailored solution cover?
- Product and SKU identification
- Brand and category information
- Product titles
- Current listed prices
- MRP and discount information where displayed
- Product specifications
- Product images
- Product URLs
- Availability signals
- Historical snapshots
- Timestamped observations
- Data normalization
- Duplicate identification
- Custom output structures
- API-based data delivery
- Dashboard-ready datasets
The solution can be particularly relevant for:
Consumer electronics brands: Monitor product positioning and competitive pricing.
Manufacturers: Track newly launched and competing models.
Retailers: Benchmark assortment and price movements.
Distributors: Monitor online product visibility and availability.
Market research companies: Build structured historical retail datasets.
Pricing teams: Identify changes and competitive movements.
The underlying data architecture should be designed around the business question. If the objective is price intelligence, pricing fields and historical observations become the priority. If the objective is catalogue intelligence, specifications, images, product identity, and category information become more important.
What Makes a Daily Dataset More Valuable Than Manual Monitoring?
Manual monitoring can work for a small number of products, but it becomes difficult to maintain when product counts, categories, and monitoring frequency increase.
A structured daily dataset provides three important advantages.
Consistency: The same fields can be collected repeatedly.
Comparability: Historical observations can be compared against current values.
Scalability: Data can be delivered to systems that support large-scale analysis.
The distinction is particularly important for electronics because product models have relatively precise identifiers and technical attributes. Monitoring those attributes alongside price and availability provides a stronger basis for product intelligence than tracking price alone.
A well-designed dataset can also help teams separate genuine product changes from simple listing variations by using SKU, model number, brand, category, and specification fields for entity matching.
What Should Businesses Measure From the Dataset?
The strongest use cases typically fall into four areas.
Pricing
Track listed price, MRP, discount, price changes, and historical price positioning.
Assortment
Monitor new listings, discontinued products, category coverage, and brand presence.
Product content
Compare titles, specifications, images, and other product attributes.
Availability
Monitor publicly visible availability signals and identify recurring changes.
These four dimensions become more powerful when combined.
For example, a price reduction occurring at the same time as an availability change provides more context than either observation alone. Similarly, a new product appearing with a particular specification set can be compared against existing products in the same category.
This is where structured e-commerce intelligence becomes a decision-support resource rather than simply a collection of product pages.
Conclusion
The Reliance Digital India Daily E-Commerce Dataset can provide the historical product-level foundation businesses need to understand pricing, assortment, content, and online availability. Reliance Retail's expansion—from ₹1,53,818 crore in FY2020-21 retail revenue and 12,711 stores to ₹3,71,085 crore and 20,160 stores in FY2025-26—illustrates the scale of the retail environment in which continuous data monitoring becomes increasingly valuable. Reliance Industries Limited
For brands and retailers, the objective should be actionable intelligence: identifying price movements, monitoring product visibility, understanding assortment changes, and detecting online availability patterns.
Actowiz Solutions can build tailored solutions around these requirements using Web scraping API, Custom Datasets, and an instant data scraper approach suited to different collection and delivery needs.
Ready to build a structured retail intelligence workflow? Contact Actowiz Solutions to discuss your product, pricing, inventory, and competitive data requirements.
You can also reach us for all your mobile app scraping, data collection, web scraping, and instant data scraper service requirements!

 By industry🏷 By platform🌐 By market
 Pricing & Promotions
MAP Violations Brand Protection Counterfeit Detection Price Intelligence AI HOT Data Intelligence
 Brand & Intelligence
Share of Search Content Audit & PDP Reviews & Ratings Retail Media Buy Box Monitoring Social Commerce HOT Live Commerce NEW Agentic Commerce NEW
 Digital Shelf & Search
Assortment Planning Competitive Benchmarking Product Availability Q-Commerce NEW
 AssortmentE-commerce Intelligence Hyperlocal Insights POI & Store Locator DTC Brand Analytics NEW
 For Retailers
 E-Commerce Dashboard
 Flipkart Insights (Live) #1
 Grocery Intelligence
.svg) Grocery Price (U.S.)
.svg) Quick Commerce (India) HOT
 Food & Restaurant
 Fashion Intelligence
 Automotive
 Travel & Hospitality
 Real Estate
 Food Delivery Intelligence NEW
 OTT & Streaming NEW
 Fuel & EV Charging Price Tracker NEW
 By Use Case
 Pricing Intelligence
 Digital Shelf Analytics
 MAP Monitoring HOT
 Cross-Border Price Parity NEW
 Share of Search
 Review Sentiment
 Kitchen Market Gaps NEW
 Dynamic Pricing / AI Repricing NEW
 Promotions & Deals Alerts NEW
 B2B / POI & Lead Data NEW
 AI Search Visibility Dashboard NEW
 Baby Products on Quick Commerce NEW
 Hotel & Flight Rate Parity NEW
 By Region🇮🇳 India 🇺🇸 USA 🇦🇪 Middle East 🇬🇧 UK 🇦🇺 Australia 🌏 SE Asia 🇪🇺 Europe 🌎 LATAMIndia
 Flipkart Real-Time Insights
 Quick Commerce — Zepto · Blinkit
 Pincode Price Tracker
Middle East
 GCC Q-Commerce — Talabat · Noon NEW
UK & Australia
 UK Grocery — Tesco, Sainsbury's, Asda
 AU Grocery — Coles & Woolworths NEW
 Marketplace Scrapers
Amazon API TikTok Shop API HOT Uber Eats API Airbnb API Zepto / Blinkit API Instacart API NEW Talabat API NEW
 Developer APIsWeb Extract API Reviews API SERP API Pricing Webhook NEW
 Universal APIsStreaming Crawl API Scheduler Realtime Alerts Webhook Delivery 🐍 Python SDK 💚 Node.js SDK
 Delivery & SDKs
 Knowledge Center
Digital Shelf Playbook MAP Compliance Guide Pricing Intel Guide Scraping Compliance TikTok Shop Guide NEW Cross-Border Guide NEW
 Guides & Playbooks
🎉 Seasonal & event tracking NEWBlack Friday pricing report Festive season, India Ramadan, GCC grocery All seasonal reportsSample Datasets HOT ROI Calculator NEW API Postman Collection Demo Dashboards Free API Playground NEW Press Kit
 Downloads & Tools
Trust Center About Us FAQs Careers
 Trust & CompanyRetail shelf research NEWRetail shelf research


 4.8/5 Average Rating
 50+ Video Testimonials
 92% Client Retention
 50+ Countries Served