Core services
Enterprise Data Extraction

Scalable web, app and AI-powered collection across 40+ countries.

All 58 services →
New 2026
AI Training Data

Corpus building with provenance and opt-out compliance.

Learn more →
Free pilot
24-hour sample

We run collection on your own sources before you commit.

Get a sample →
58Services
40+Countries
DEVELOPER

Ready-Made Scrapers

Pre-built for top platforms. Self-serve, no setup.

View All →
TRY FREE

API Playground

Test endpoints instantly. No credit card.

Start Free →
28Tools
2SDKs
icons Delivery & SDKs
Streaming Crawl API Scheduler Realtime Alerts Webhook Delivery 🐍 Python SDK 💚 Node.js SDK

Need it managed instead?

Fixed monthly retainer, named engineer, no per-request metering.

Managed Data API →
HOT

Case Studies

How brands use Actowiz, with named outcomes.

Read →
FREE

Sample Datasets

Real output, no signup.

Download →
NEW

ROI Calculator

Model the return on a data engagement.

Calculate →
Wine Retail Price Tracking API 2026: Monitor 8 SKUs

Introduction

Retail alternative data is public information collected from retailer and marketplace websites, such as prices, promotions, product ranges, stock status, new listings, reviews and search rank, and turned into time series that investors can compare with company results. Used well, it gives an earlier, more detailed view of pricing power, demand and execution than quarterly reports alone.

This guide is the retail-signal part of our wider alternative-data series. If you want the broad overview of how funds use web data, start with our alternative data for hedge funds use cases. Here we go deeper on one family of signals: what you can read from product pages and shelves online.

We cover the signal types, how to build a stable SKU panel, how to match products, how to avoid survivorship bias, how to test signals against reported numbers, and the compliance basics buy-side teams expect.

Note: This article is general information about data methods. It is not investment advice, and no signal described here should be used on its own to make an investment decision.

Why do investors use retail alternative data?

Wine Retail Price Tracking API 2026: Monitor 8 SKUs

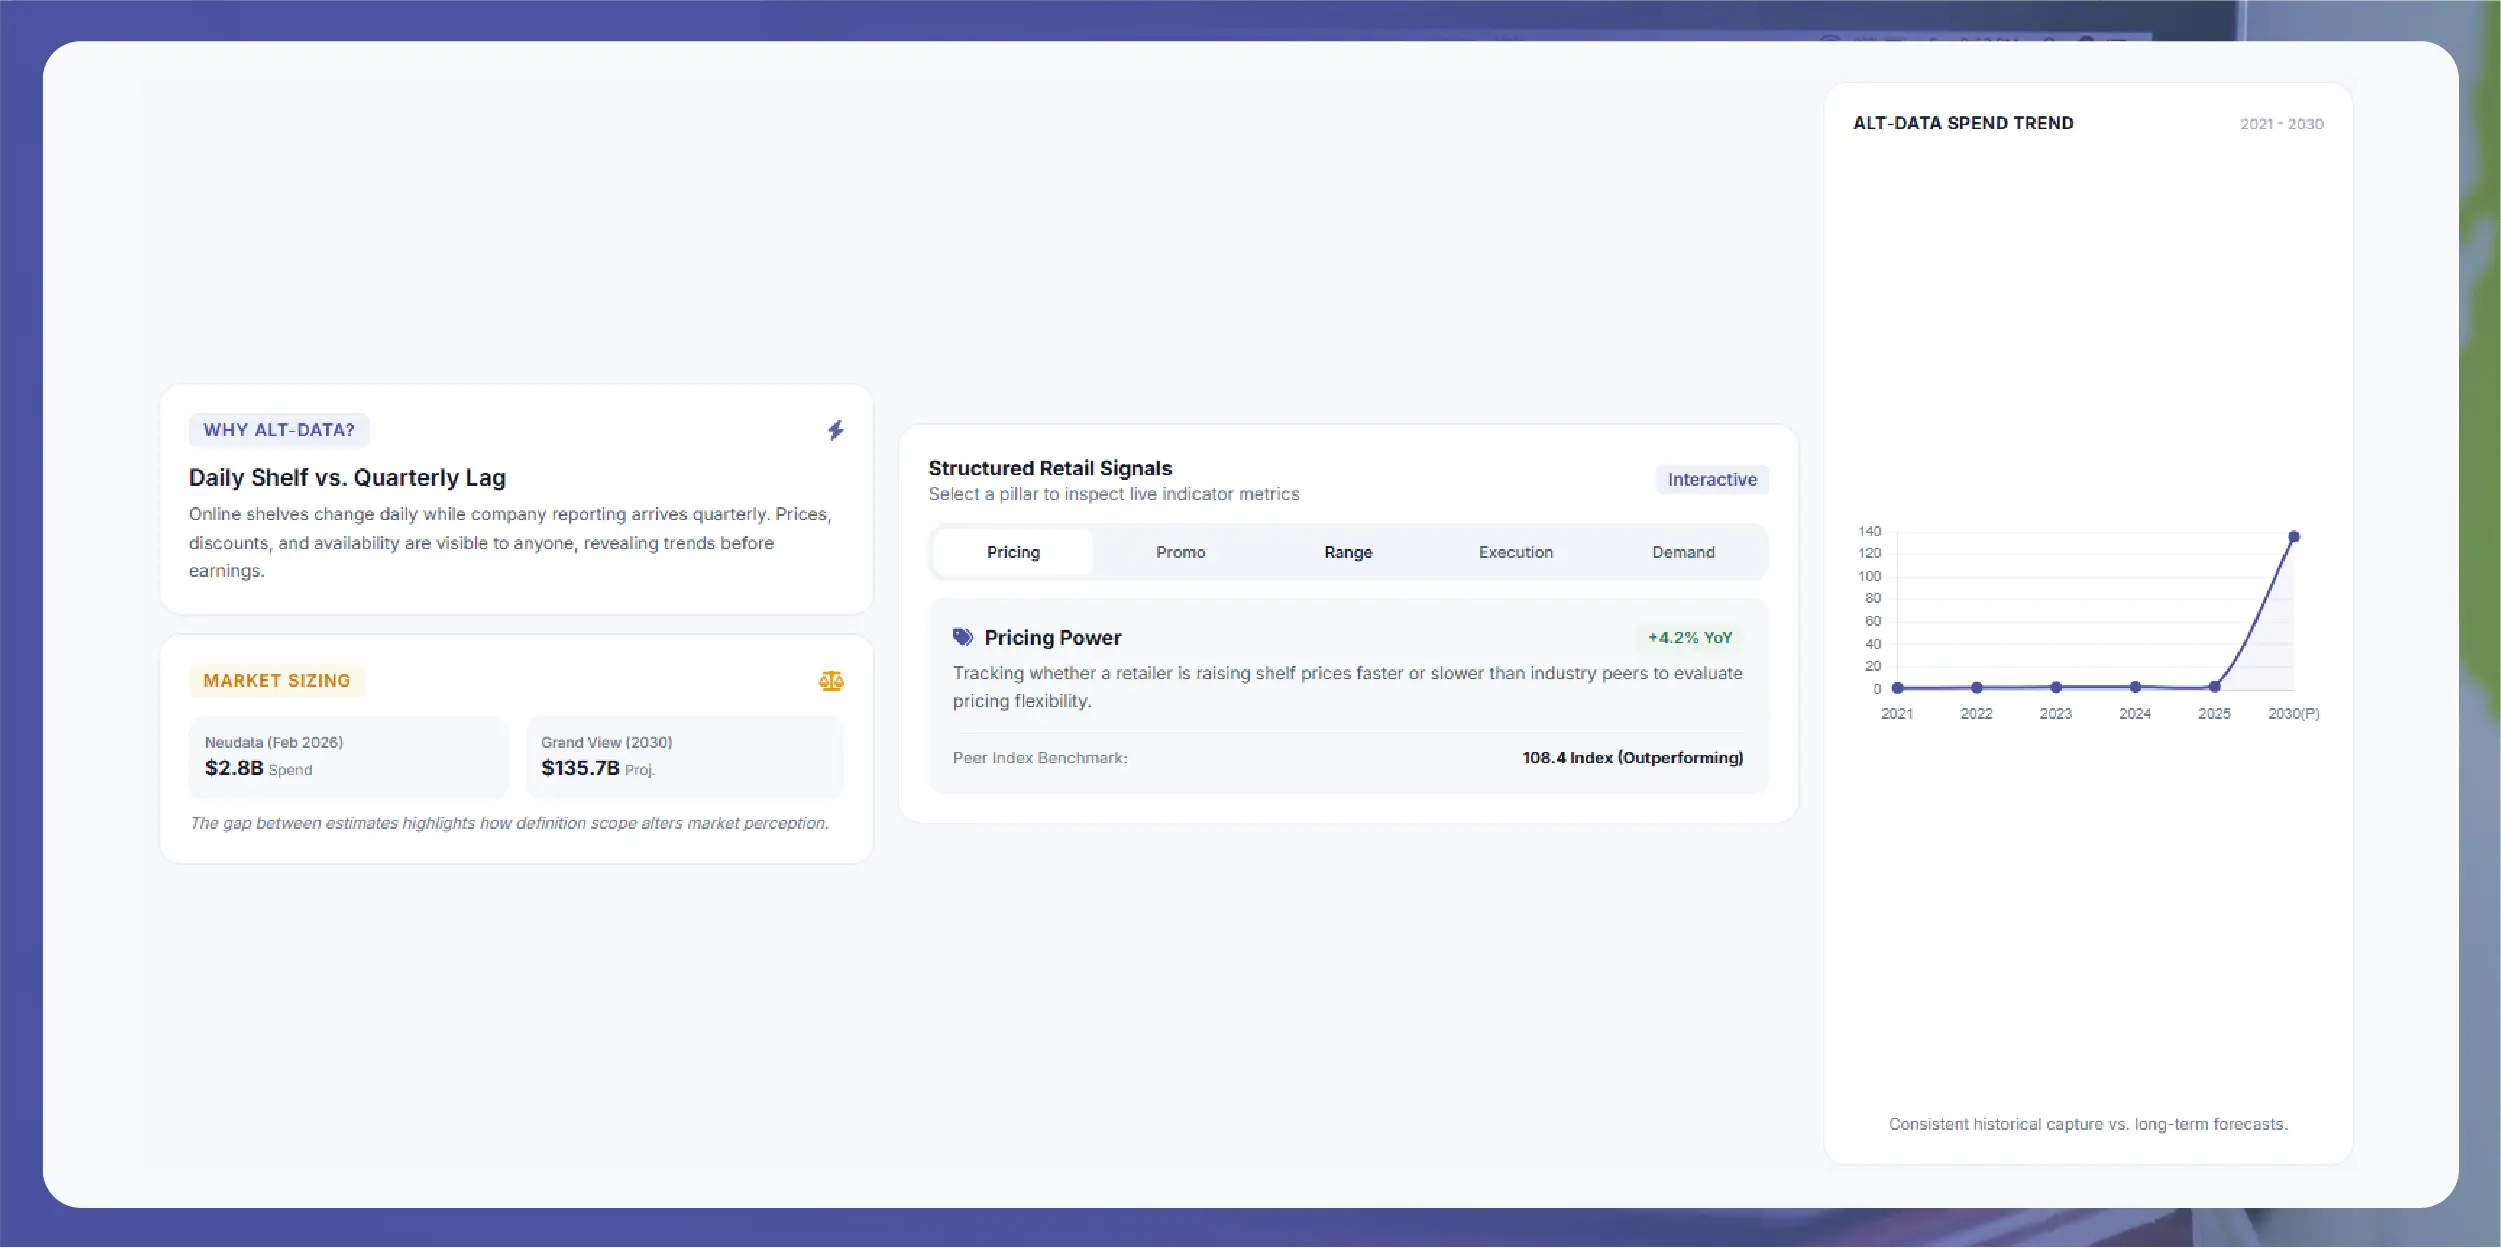
Investors use retail alternative data because online shelves change daily while company reporting arrives quarterly. Prices, discounts and availability are visible to anyone, so a consistent record of them can show trends before they appear in results.

Interest in alternative data overall is large but hard to size. Neudata estimates that investment managers spent about $2.8 billion on alternative data in 2025, up around 17% on the year, based on its dataset platform and buyer surveys (Neudata, February 2026). Grand View Research uses a much wider market definition and projects the global alternative data market at about $135.7 billion by 2030 (Grand View Research). Both are estimates, and the gap between them shows how much the definition matters.

Retail alternative data is a natural fit because the data is structured and repeatable:

  • Pricing power. Is a retailer raising shelf prices faster or slower than peers?
  • Promotional intensity. Are discounts getting deeper or more frequent, which can hint at margin pressure?
  • Range strategy. Is a brand or retailer widening or cutting its assortment?
  • Execution. Are key products out of stock in important regions or channels?
  • Demand hints. Are review counts and best-seller ranks rising for a brand's products?

What retail alternative data signals can you track?

Most useful retail alternative data signals fall into seven groups. Each one answers a different question, and each has its own common traps.

Signal What it measures How it is built Typical cadence Main caveat
Online price index Shelf price change for a fixed basket Same SKUs priced over time, weighted or equal-weighted Daily or weekly Basket drift and pack-size changes
Promo depth and frequency How deep and how often discounts run Current price vs reference or was price, share of SKUs on promo Daily Reference prices differ by retailer
Assortment breadth Number of products listed by brand, category or retailer Count of active listings in defined categories Weekly Category tree changes on the site
Stock-outs Share of tracked SKUs unavailable, and for how long In-stock flag and duration per SKU, store or postcode Daily or intraday Delisted vs temporarily out
New listings Product launches and range additions First-seen date for new product IDs Weekly Relistings that look new
Review velocity Growth in public review counts Change in review count per SKU over time Weekly Review syndication across sites
Search or best-seller rank Visibility and relative demand on a marketplace Position in search results or category ranks Daily Sponsored placements and personalisation

Two of these are often underused. Stock-out duration says more than a simple in-stock flag, because a one-hour gap and a two-week gap mean very different things. Our stock and availability data service records transitions so duration can be measured. New listings are useful for spotting launches and private-label pushes early.

For signals based on job postings, employer reviews and sentiment, see our separate guide on job postings and sentiment signals for hedge funds.

How do you build a reliable SKU panel?

A SKU panel is a fixed, documented set of products tracked the same way over time. It is the foundation of any retail alternative data signal, because a moving basket produces moving numbers that have nothing to do with the company.

In-body image: workflow diagram. File: retail-sku-panel-workflow.webp | Alt: "Workflow diagram from retailer pages to matched SKU panel to weekly signal file"

  • Define the question first. For example, "Is Retailer A raising private-label prices faster than branded goods?" The question decides which retailers, categories and regions you need.
  • Pick sources and regions. Choose retailers and marketplaces that matter for the company, and fix the locations (country, city or postcode) because prices and stock often vary by location.

  • Set a fixed basket. Select SKUs that represent the category and record them with stable product IDs. Keep a core basket that does not change, plus a separate list for new products.
  • Match products across sites. Use GTIN or EAN where shown, then brand, product name, size and pack count. Our product matching services combine rules with manual review for hard cases.
  • Normalise units. Convert to price per unit (per 100 g, per litre, per item) so pack-size changes do not look like price rises or cuts.
  • Keep a point-in-time record. Store each observation with its capture timestamp and never overwrite history. Back-tests need to see the data as it looked on the day.

How do you handle survivorship and basket drift?

Survivorship bias appears when products that disappear are silently dropped, so the panel only contains "survivors". This can make price or stock trends look better or worse than reality.

  • Keep delisted SKUs in the history with a clear status (delisted, replaced, out of stock).
  • Link replacements when a product is relaunched under a new ID or pack size.
  • Report panel coverage each period: how many core SKUs were found, missing or replaced.
  • Separate "out of stock" from "no longer listed", because they mean different things for demand and range strategy.

How do you collect and clean retail web data?

Collecting retail alternative data should copy what a normal anonymous shopper sees, at a steady cadence, with a clear log of what was captured and when. Cleaning then turns raw pages into consistent fields.

Field Description Why it matters for investors
capture_timestamp Date and time of observation (UTC) Point-in-time integrity for back-tests
retailer / marketplace Source site and country Lets you compare retailers fairly
location City, store or postcode used Prices and stock vary by location
product_id / gtin Site ID and GTIN or EAN where shown Stable matching over time
brand, category Brand and mapped category Brand and category roll-ups
price_current, price_reference Shelf price and was or list price Price index and promo depth
unit_price Price per standard unit Removes pack-size effects
promo_flag, promo_text Discount, coupon or multi-buy shown Promotional intensity
in_stock, listed Availability and listing status Stock-outs vs delistings
review_count, rating Public review totals and average Review velocity
rank Search or category position Visibility and demand hints

Quality checks should run on every delivery: price outliers (for example a 90% drop that is really a unit error), sudden falls in SKU coverage, duplicate records and currency errors. Our price monitoring services use the same checks for brands and retailers.

How do you validate signals against reported results?

A retail alternative data signal is only useful if it has a stable, explainable link to something the company reports. Validation means testing that link honestly before relying on it.

  • Map signal to metric. Match each signal to a reported figure: price index to reported average selling price or inflation commentary, stock-outs to comments on availability, assortment to store or range updates, review velocity to unit trends.
  • Align the periods. Aggregate daily data to the company's fiscal quarters and weeks, not calendar months.
  • Use enough history. A few quarters are not enough to judge a relationship. Seasonal signals need several years of point-in-time data.
  • Check direction and size. Look at whether the signal moved in the same direction as the reported figure, and how often.
  • Test out of sample. Fit on older periods and check on later ones. A signal that only works in-sample is likely noise.
  • Explain misses. Note quarters where the signal failed and why (a site redesign, a change in product mix, a one-off event).

In-body image: comparison chart. File: price-index-vs-reported-results.webp | Alt: "Chart comparing a web-scraped price index with a retailer's reported quarterly figures" – [Insert Actowiz dataset value] for the index; reported figures from the company's own filings.

Treat validation results as evidence, not proof. Online data covers the online shelf, which may differ from in-store prices or from a company's total sales mix.

What are the compliance basics for retail alternative data?

Buy-side compliance teams want to know where data comes from and that it contains no material non-public information (MNPI) or personal data. Retail alternative data is usually lower risk because it is public, but the collection method still matters.

Law firm guidance for alternative-data vendors highlights MNPI controls, clear data provenance, respect for contractual and third-party rights, and privacy compliance (Lowenstein Sandler). Industry groups such as the FISD Alternative Data Council publish due-diligence questionnaires that many funds use.

  • Public data only. Collect what an anonymous visitor can see. No logins, paywalls or private seller portals.
  • No personal data. Do not collect reviewer names, profiles or any customer details. Review counts and ratings are enough for velocity signals.
  • Respect site terms. Review each source's terms and robots guidance, collect at a polite rate and avoid placing load on sites.
  • Document provenance. Keep a source list, collection method, timestamps and change log ready for due-diligence questionnaires.
  • Legal review. Your own counsel should approve sources and use. This guide is not legal advice.

Should you build or buy a retail SKU panel?

Building a retail alternative data panel in-house makes sense when you have engineers, a narrow question and time to maintain scrapers. Buying makes sense when you need many retailers, several countries, matching and a clean history quickly.

Factor Build in-house Managed data provider
Time to first data Weeks to months per source Usually faster, depends on scope
Maintenance Your team fixes site changes Provider monitors and repairs
Product matching You design rules and review queues Matching included, with review
Point-in-time history You must store and version it Delivered as dated snapshots
Compliance pack You write provenance documents Provider supplies source and method notes
Control Full control of logic Shared, agreed in specification

Whichever route you choose for retail alternative data, ask for a sample, a field dictionary, coverage numbers and a clear statement of what is not collected.

Frequently Asked Questions

What is retail alternative data?

It is public retail information, such as online prices, promotions, product ranges, stock status, new listings, reviews and ranks, collected over time and used to understand company or sector trends.

Is retail alternative data considered MNPI?

Data that any member of the public can see on a website is generally not treated as non-public, but your compliance team must confirm this for each source and collection method.

How many SKUs does a useful panel need?

It depends on the question. A brand-level price question may need a few hundred well-matched SKUs per retailer, while a category or sector view needs more. Coverage stability matters more than raw size.

How often should retail data be collected?

Daily is common for prices, promotions and stock. Assortment and new listings are often fine weekly. Fast-moving categories or quick-commerce apps may need intraday checks.

Can online stock-outs predict sales?

They can hint at supply problems or strong demand, but they need context. Separate temporary stock-outs from delistings and test the signal against reported results before relying on it.

Does Actowiz provide investment signals or advice?

No. Actowiz supplies collected and cleaned data, such as SKU panels, price and stock time series. Analysis and investment decisions stay with your team.

Conclusion

How to choose a web scraping company comes down to evidence: a sample on your own sites, a written SLA, a clear compliance policy and a pilot scored the same way for every vendor. Use the checklist above, ignore promises of perfect data, and pick the partner whose data holds up when you check it.

Ready to test a web scraping partner on your own sites? Contact Actowiz Solutions to request a free sample dataset and start a scoped pilot.

You can also reach us for all your mobile app scraping, data collection, web scraping , and instant data scraper service requirements!

Share the retailers, countries and categories you follow, and we will send a sample SKU panel with prices, promo flags, stock status and capture timestamps. Contact Sales to start.
Get a free sample dataset
Social Proof That Converts

Trusted by Global Leaders Across Q-Commerce, Travel, Retail, and FoodTech

Our web scraping expertise is relied on by 4,000+ global enterprises including Zomato, Tata Consumer, Subway, and Expedia — helping them turn web data into growth.

4,000+ Enterprises Worldwide
50+ Countries Served
20+ Industries
Join 4,000+ companies growing with Actowiz →
Real Results from Real Clients

Hear It Directly from Our Clients

Watch how businesses like yours are using Actowiz data to drive growth.

▶
1 min
★★★★★
"Actowiz Solutions offered exceptional support with transparency and guidance throughout. Anna and Saga made the process easy for a non-technical user like me. Great service, fair pricing!"
TG
Thomas Galido
Co-Founder / Head of Product at Upright Data Inc.
▶
2 min
★★★★★
"Actowiz delivered impeccable results for our company. Their team ensured data accuracy and on-time delivery. The competitive intelligence completely transformed our pricing strategy."
II
Iulen Ibanez
CEO / Datacy.es
▶
1:30
★★★★★
"What impressed me most was the speed — we went from requirement to production data in under 48 hours. The API integration was seamless and the support team is always responsive."
FC
Febbin Chacko
-Fin, Small Business Owner
icons 4.8/5 Average Rating
icons 50+ Video Testimonials
icons 92% Client Retention
icons 50+ Countries Served

Join 4,000+ Companies Growing with Actowiz

From Zomato to Expedia — see why global leaders trust us with their data.

Why Global Leaders Trust Actowiz

Backed by automation, data volume, and enterprise-grade scale — we help businesses from startups to Fortune 500s extract competitive insights across the USA, UK, UAE, and beyond.

icons
7+
Years of Experience
Proven track record delivering enterprise-grade web scraping and data intelligence solutions.
icons
4,000+
Projects Delivered
Serving startups to Fortune 500 companies across 50+ countries worldwide.
icons
200+
In-House Experts
Dedicated engineers across scrapers, AI/ML models, APIs, and data quality assurance.
icons
9.2M
Automated Workflows
Running weekly across eCommerce, Quick Commerce, Travel, Real Estate, and Food industries.
icons
270+ TB
Data Transferred
Real-time and batch data scraping at massive scale, across industries globally.
icons
380M+
Pages Crawled Weekly
Scaled infrastructure for comprehensive global data coverage with 99% accuracy.

AI Solutions Engineered
for Your Needs

→
LLM-Powered Attribute Extraction: High-precision product matching using large language models for accurate data classification.
→
Advanced Computer Vision: Fine-grained object detection for precise product classification using text and image embeddings.
→
GPT-Based Analytics Layer: Natural language query-based reporting and visualization for business intelligence.
→
Human-in-the-Loop AI: Continuous feedback loop to improve AI model accuracy over time.
icons Product Matching icons Attribute Tagging icons Content Optimization icons Sentiment Analysis icons Prompt-Based Reporting

Connect the Dots Across
Your Retail Ecosystem

We partner with agencies, system integrators, and technology platforms to deliver end-to-end solutions across the retail and digital shelf ecosystem.

icons
Analytics Services
icons
Ad Tech
icons
Price Optimization
icons
Business Consulting
icons
System Integration
icons
Market Research
Become a Partner →

Popular Datasets — Ready to Download

Browse All Datasets →
icons
Amazon
eCommerce
Free 100 rows
icons
Zillow
Real Estate
Free 100 rows
icons
DoorDash
Food Delivery
Free 100 rows
icons
Walmart
Retail
Free 100 rows
icons
Booking.com
Travel
Free 100 rows
icons
Indeed
Jobs
Free 100 rows

Latest Insights & Resources

View All Resources →
thumb
Blog

Retail Alternative Data for Investors: Price, Assortment and Stock-Out Signals (2026)

Retail alternative data guide for investors: build SKU panels, track price, promo, assortment and stock-out signals, and validate them.

thumb
Case Study

How Sensitive Skin Skincare Product Data API Helps Brands Track Cleansers, Serums, Moisturizers, and Sunscreens

Sensitive Skin Skincare Product Data API helps brands track cleansers, serums, moisturizers, and sunscreens with structured product data.

thumb
Report

UAE Online Grocery & Quick Commerce Market Data Report 2026 for UAE Retail Intelligence

UAE online grocery market 2026: talabat mart, noon Minutes, Careem Quik, Amazon Now, Carrefour and Lulu compared on prices and delivery.

Start Where It Makes Sense for You

Whether you're a startup or a Fortune 500 — we have the right plan for your data needs.

icons
Enterprise
Book a Strategy Call
Custom solutions, dedicated support, volume pricing for large-scale needs.
icons
Growing Brand
Get Free Sample Data
Try before you buy — 500 rows of real data, delivered in 2 hours. No strings.
icons
Just Exploring
View Plans & Pricing
Transparent plans from $500/mo. Find the right fit for your budget and scale.
Get in Touch
Let's Talk About
Your Data Needs
Tell us what data you need — we'll scope it for free and share a sample within hours.
  • icons
    Free Sample in 2 HoursShare your requirement, get 500 rows of real data — no commitment.
  • icons
    Plans from $500/monthFlexible pricing for startups, growing brands, and enterprises.
  • icons
    US-Based SupportOffices in New York & California. Aligned with your timezone.
  • icons
    ISO 9001 & 27001 CertifiedEnterprise-grade security and quality standards.
Request Free Sample Data
Fill the form below — our team will reach out within 2 hours.
+1 ▼
✓ Free 500-row sample · No credit card · Response within 2 hours

Request Free Sample Data

Our team will reach out within 2 hours with 500 rows of real data — no credit card required.

+1 ▼
✓ Free 500-row sample · No credit card · Response within 2 hours