Introduction
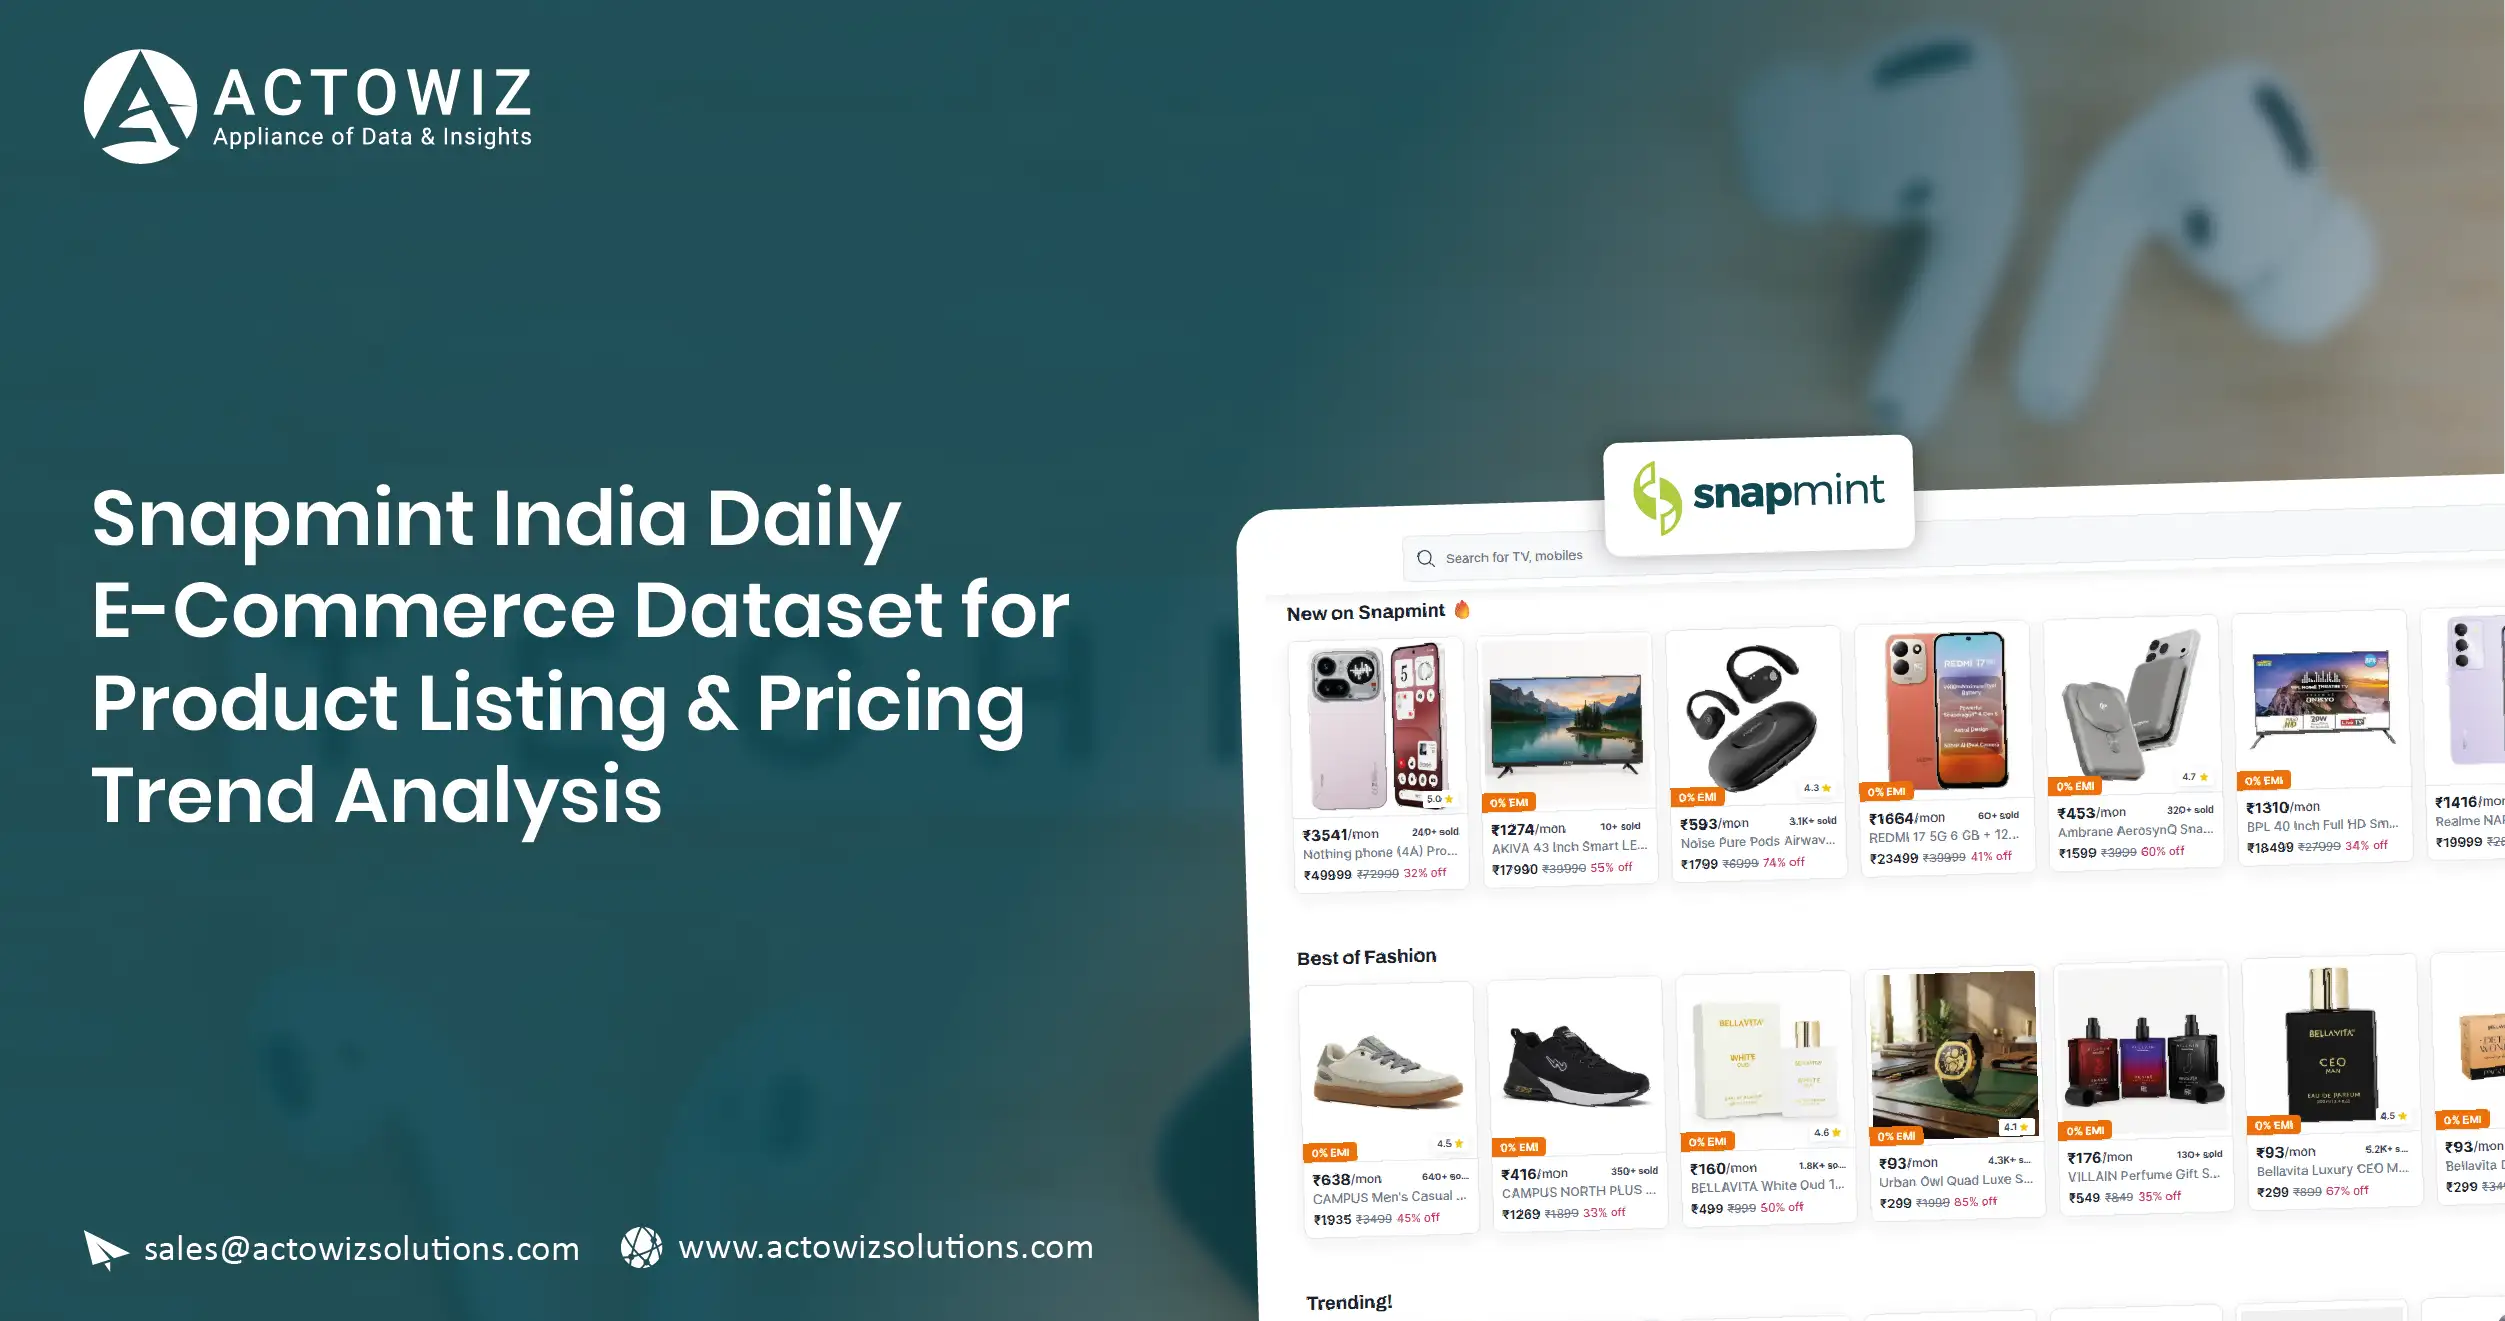
The Snapmint India Daily E-Commerce Dataset helps businesses organize product listings, analyze displayed prices, examine available EMI offers, and monitor changes in online retail information. For retailers, consumer brands, sellers, and market researchers, daily product-level observations can support pricing comparisons, product research, and competitive analysis when the collected data is accurate and consistently maintained.
Snapmint operates in India's consumer purchasing ecosystem, where installment-based payment options can influence how shoppers evaluate products and affordability. Businesses analyzing product listings therefore need to distinguish a product's displayed price from its installment amount, repayment duration, eligibility requirements, and other financing conditions. A well-structured dataset makes these details easier to compare without confusing an EMI offer with a direct discount.
An E-Commerce Dashboard can present validated product information, price observations, and available offer details in an accessible format. Combined with historical records, it can help teams identify changes, investigate unusual observations, and prepare repeatable reports for commercial decisions.
Actowiz Solutions can help businesses plan data collection workflows around accessible source information and specific research requirements. The priority is to build a reliable dataset with identifiable products, dated observations, documented collection results, and transparent limitations.
How Can Daily Price Records Improve Product Comparisons?
The Snapmint India Daily Products Price Dataset can help businesses compare product-level price observations across collection dates, provided the underlying source displays the relevant information. Through Ecommerce Data Scraping, teams can organize product names, brands, model identifiers, displayed prices, product URLs, and collection timestamps into a consistent analytical structure.
For commercial teams, the first requirement is to identify the exact product being compared. Two listings with similar names may represent different storage capacities, model generations, bundles, or configurations. Comparing prices without validating these attributes can lead to incorrect conclusions about price reductions or competitive positioning.
Daily collection provides a dated record of what was displayed at a particular observation time. It does not establish the price at every moment between observations, nor does it prove that a purchase occurred at the displayed amount.
Which price fields should businesses capture?
| Data field |
Analytical purpose |
| Product name and identifier |
Match the same product across observations |
| Brand and model |
Support consistent product comparisons |
| Variant or configuration |
Prevent comparisons between different versions |
| Displayed price |
Record the price shown by the source |
| Currency |
Standardize price interpretation |
| Collection timestamp |
Establish when the observation occurred |
| Source URL |
Allow the observation to be checked against its source |
| Promotional conditions |
Distinguish unconditional prices from offer-dependent amounts |
Once records are validated, businesses can calculate absolute price changes by subtracting an earlier price from a later price. Percentage changes can be calculated relative to the earlier price, provided it is nonzero and both observations represent the same product and pricing basis.
For a 2020–2026 review, historical records must be available for the period being analyzed. A daily dataset collected in 2026 cannot independently establish what a product cost in 2020. Archived source pages or previously retained, timestamped records are necessary to support those historical conclusions.
This approach is useful for pricing analysts, category managers, and research teams that need evidence-based comparisons instead of manually collected, inconsistent product information.
How Can Electronics Product Records Support Category Planning?
Snapmint Electronics' Products Data Collection can help businesses organize publicly accessible information about electronics listings, including brands, model numbers, technical specifications, displayed prices, and product-page details. A consistent collection process makes it easier to review product assortment and compare similar devices across available records.
Electronics listings require careful normalization because small specification differences can materially affect price comparisons. Smartphones, laptops, televisions, and accessories may have multiple configurations, bundled products, or model generations. A dataset that stores only the product title and price may fail to distinguish these differences.
Category managers should retain both the original listing title and normalized product attributes. The original text supports source verification, while standardized fields make filtering and comparison more efficient.
Which fields are most useful for electronics analysis?
| Information group |
Relevant fields |
Practical application |
| Product identity |
Brand, model, product identifier |
Match equivalent products |
| Specifications |
Storage, memory, screen size, configuration |
Compare like-for-like products |
| Pricing |
Displayed price and currency |
Review price positioning |
| Financing |
Displayed installment amount and stated tenure, where available |
Examine disclosed payment options |
| Offers |
Discount text, coupon terms, eligibility conditions |
Separate promotional claims from standard prices |
| Source information |
URL and collection timestamp |
Validate individual records |
India's e-commerce growth makes structured catalogue analysis relevant to a broad range of retail businesses. Bain & Company's How India Shops Online 2025, prepared with Flipkart, estimated India's e-retail market at approximately US$60 billion in gross merchandise value in 2024, with more than 270 million online shoppers. These figures describe the national market and should not be interpreted as Snapmint's sales, customer base, or product coverage. Source: Bain & Company, How India Shops Online 2025.
For businesses reviewing records from 2020 through 2026, category analysis should be based on the observations available for each year. Historical catalogue coverage cannot be established from today's product pages alone.
The operational benefit is a more consistent product reference dataset. Teams can filter products by brand and configuration, identify incomplete records, and investigate whether a price difference reflects a genuine change or a mismatch between product variants. These checks make catalogue reporting more useful for merchandising and competitive research.
How Can Product Prices and EMI Offers Be Evaluated Together?
The Snapmint product pricing and EMI dataset can bring together product-level prices and the installment information displayed alongside them. With Real-Time Price Monitoring, businesses can review changes across scheduled collection windows, although three daily snapshots or another defined schedule should not be described as continuous real-time observation.
Installment offers introduce additional variables into product comparisons. A displayed EMI amount is not the same as a product's total price, and a low installment amount does not automatically mean the product is cheaper. Tenure, down payment, interest, processing charges, eligibility, and applicable offer conditions may affect the final cost.
For accurate analysis, businesses should store the standard displayed price separately from installment information. Where the source provides sufficient details, analysts can also record the stated repayment duration, upfront payment, interest terms, fees, and eligibility requirements. Missing values should remain explicitly unavailable rather than being inferred.
Which pricing and financing details should be compared?
| Data point |
What it establishes |
What it does not establish by itself |
| Displayed product price |
The price shown in the captured listing |
The final amount paid by every buyer |
| EMI amount |
The stated installment amount |
The complete repayment cost |
| Repayment tenure |
The stated number of installments or duration |
Whether a customer qualifies |
| Down payment |
The stated upfront payment, if disclosed |
All other charges |
| Promotional benefit |
The advertised benefit and its terms |
Universal eligibility |
| Collection timestamp |
When the offer was observed |
How long the offer remained valid |
For example, comparing two EMI amounts without checking their repayment tenures can produce a misleading result. Likewise, a price reduction linked to a specific payment method should not be recorded as an unconditional discount.
India's digital payment infrastructure has expanded substantially. The Reserve Bank of India's Digital Payments Index reached 465.33 in September 2024, up from 445.50 in March 2024, with March 2018 set as the base at 100. This index measures the extent of digital payment adoption and infrastructure; it is not a measure of Snapmint usage or EMI transactions. Source: Reserve Bank of India, January 29, 2025.
For the 2020–2026 period, businesses should preserve dated offer observations and the applicable conditions. A historical financing comparison is defensible only when the recorded terms can be verified for the relevant product and date.
This structured approach helps pricing and research teams assess the difference between product affordability, advertised financing, and the underlying listed price without treating these separate measures as interchangeable.
How Can Customer Feedback Improve Product Research?
The Snapmint Review & Rating Data API use case focuses on collecting publicly displayed customer ratings, review counts, and review text where these are accessible and permitted. When available, these fields can add customer-feedback context to product and pricing analysis.
Review information needs careful interpretation. An average rating summarizes a collection of responses, but it does not explain every customer's experience. Review counts, dates, product variants, and the context of the feedback help analysts understand what a displayed rating represents.
Businesses should not assume that every Snapmint product page contains reviews or that a rating feed is available through a public API. The source, accessible fields, and permitted collection method should be confirmed before implementation.
Which review indicators should analysts retain?
| Field |
Why it matters |
| Displayed rating |
Records the rating shown at collection time |
| Review count |
Provides context for the displayed average |
| Review text |
Preserves available customer feedback for analysis |
| Review timestamp |
Helps establish when the feedback was published, if disclosed |
| Product identifier |
Links feedback to the correct product or variant |
| Collection timestamp |
Records when the rating or review count was observed |
| Source URL |
Supports verification and troubleshooting |
A dated record of a rating can reveal that the displayed value changed between observations. However, the change should not be attributed to a particular customer or event unless additional evidence supports that explanation.
Review text can be classified into relevant themes, such as product quality, usability, delivery, or value for money, when the text is available and analysis is appropriate. Such classifications should be validated and should not be presented as statistically representative of all customers unless the sampling method justifies that conclusion.
For historical analysis from 2020 to 2026, teams need archived reviews or previously collected records with dates. A current rating cannot establish what customers rated a product several years earlier. Review collection must also respect privacy requirements and applicable platform restrictions.
When combined with verified product attributes and price observations, customer feedback can provide additional context for market research. It should remain a separate evidence stream, not a substitute for sales figures, product testing, or independently verified customer satisfaction measures.
Why Is Product-Variant Tracking Essential for Reliable Reporting?
Snapmint India daily SKU-level Data Scraping can help businesses organize observations around individual product variants rather than broad product names. When linked to the Snapmint India Daily E-Commerce Dataset, this approach supports consistent comparisons of product attributes, displayed prices, and available offer information across collection dates.
SKU-level tracking is important because two listings can have similar names but different specifications. A phone with 128 GB of storage should not automatically be compared with a 256 GB version, and a product bundle should not be treated as identical to a standalone item. Variant mismatches can distort price-change calculations and category comparisons.
A practical dataset should use a product master table for stable attributes and a separate observation table for information that changes over time. The product master can contain the normalized brand, model, and variant, while observation records retain dated prices, displayed financing terms, availability messages, and source details.
How should product-level information be structured?
| Dataset component |
Suggested fields |
Reporting value |
| Product master |
Product ID, brand, model, variant |
Establishes product identity |
| Price observations |
Timestamp, listed price, currency |
Supports price-history calculations |
| Financing observations |
EMI amount, tenure, disclosed conditions |
Supports installment-offer comparisons |
| Listing observations |
URL, page status, collection result |
Helps investigate listing changes |
| Feedback observations |
Rating, review count, review date where available |
Preserves dated customer-feedback indicators |
| Quality controls |
Validation status, missing fields, duplicate flags |
Makes reporting limitations visible |
Businesses can use these records to identify products with complete histories, locate gaps in collection coverage, and compare prices only when the product identity is sufficiently consistent. They can also distinguish a genuine price change from an update to the product's specifications or promotional terms.
For the 2020–2026 period, SKU-level reporting requires historical product records and a documented matching process. A current SKU or product URL does not necessarily establish that the same variant was listed under the same identifier in earlier years. Changes in naming, product pages, and catalogue structure should be checked before records are combined.
A useful quality measure is observation completeness: the number of successfully captured records divided by the number of records expected under the agreed collection schedule. This indicates coverage, not accuracy, so it should be considered alongside validation results.
These controls are particularly valuable for businesses preparing recurring reports. Analysts can trace unusual values back to their original records, identify incomplete periods, and avoid drawing conclusions from mismatched or unverified products.
How Can Product and Availability Records Reveal Market Changes?
Snapmint product price and availability data Extraction can help businesses review changes in displayed prices and product-page availability together. This combination is useful because price observations are easier to interpret when analysts also know whether the relevant listing was accessible and what status it displayed at the time.
The data can support questions about product coverage, promotional visibility, and the continuity of individual listings. However, website observations do not automatically reveal actual inventory, completed sales, customer demand, or the reasons behind a listing change.
A product that disappears from a collection may have moved to another URL, become inaccessible, or been removed from the visible catalogue. Analysts should preserve these distinctions rather than assigning an out-of-stock status without direct evidence.
Which indicators can support a market review?
| Indicator |
Evidence required |
Appropriate interpretation |
| Price movement |
Comparable, dated product prices |
Change in displayed price |
| Availability change |
Timestamped status observations |
Change in displayed availability |
| Product coverage |
Repeated observations of identifiable listings |
Changes in the observed catalogue |
| Offer visibility |
Dated promotional terms |
Changes in displayed offers |
| Financing changes |
Dated EMI details and conditions |
Changes in published installment information |
| Data completeness |
Expected versus successfully collected observations |
Reliability of collection coverage |
A wider market perspective can help explain the importance of consistent online retail analysis. Bain & Company's How India Shops Online 2025 estimated that India's e-retail market grew to approximately US$60 billion in 2024, while its How India Shops Online 2023 report placed the market at roughly US$57–60 billion in 2023. The estimates use rounded ranges and should not be interpreted as a precise annual growth calculation. Sources: Bain & Company, 2023 and Bain & Company, 2025.
These national figures provide context for India's e-retail environment; they do not measure Snapmint's catalogue size, price changes, or market share.
A sound 2020–2026 study should separate completed-year observations from current year-to-date data. It should also document collection frequency, source changes, missing records, and the criteria used to match products. Without that information, apparent trends may reflect changes in data collection rather than changes in the market.
For business teams, the main benefit is a traceable evidence base. Product, pricing, and availability records can be combined to identify observations that merit further investigation, prioritize category reviews, and improve the consistency of market research.
How Can Actowiz Solutions Help Businesses Turn Retail Data Into Insights?
Actowiz Solutions can help retailers, consumer brands, marketplace sellers, and market research teams plan structured data collection workflows based on their business objectives. The focus is on collecting relevant source information, validating product records, preserving historical observations, and preparing datasets for analysis.
The Snapmint India Daily E-Commerce Dataset can be scoped around product listings, displayed prices, disclosed EMI details, promotional conditions, customer feedback where available, and listing status. The exact coverage depends on source accessibility, collection feasibility, and the fields available during implementation.
Which capabilities can support your business?
- Tailored data collection
Define the required product categories, fields, collection frequency, and delivery format. A clear scope helps ensure that the dataset addresses actual business questions rather than collecting unnecessary information.
- Product matching and normalization
Standardize product names, brands, model identifiers, and configurations while retaining original source values. This helps reduce duplicate records and supports more accurate comparisons.
- Historical record management
Store timestamped observations instead of overwriting previous values. Retained records make it possible to investigate changes, calculate historical price movements, and identify gaps in coverage.
- Data validation
Apply checks for missing prices, duplicate listings, invalid values, inconsistent identifiers, and unexpected source changes. Separate failed collection attempts from genuine changes in product status.
- Reporting and integration
Prepare validated data for spreadsheets, databases, reporting tools, and business intelligence systems. Where required, organize the output into product master records, daily observations, and supporting quality information.
What should buyers establish before implementation?
| Requirement |
Questions to answer |
| Product scope |
Which brands, categories, and variants are required? |
| Collection schedule |
How frequently should records be collected? |
| Historical coverage |
Which years have verifiable archived observations? |
| Financing details |
Which EMI fields and offer conditions are actually accessible? |
| Data delivery |
Is the preferred output a spreadsheet, database, API, or dashboard-ready dataset? |
| Quality standards |
How will missing fields, duplicates, and collection failures be handled? |
| Compliance |
Which legal, privacy, contractual, and website-access requirements apply? |
Actowiz Solutions can help translate these requirements into a defined data collection and delivery plan. Before deployment, businesses should confirm the accessible source fields, expected coverage, validation rules, and delivery commitments. No historical or platform-specific metric should be assumed until it has been verified.
The goal is to create a dataset that analysts can trace back to its source, understand in context, and use confidently for product research, pricing analysis, and commercial reporting.
Conclusion
The Snapmint ecosystem offers a useful context for examining product information, displayed prices, installment offers, and changes in online listings. A well-designed daily dataset can help businesses compare observations, assess disclosed financing conditions, and identify changes that warrant further analysis.
Reliable results depend on consistent product identifiers, accurate timestamps, documented offer terms, and transparent treatment of missing records. Historical conclusions covering 2020–2026 must be supported by actual dated observations, while national e-commerce statistics should remain separate from platform-specific performance claims.
Actowiz Solutions helps businesses explore structured data collection and tailored delivery workflows to support these requirements.
Ready to improve your product and pricing intelligence? Contact Actowiz Solutions to discuss a tailored Web scraping API, business-specific Custom Datasets, or an instant data scraper solution for your e-commerce research needs.
You can also reach us for all your mobile app scraping, data collection, web scraping, and instant data scraper service requirements!
Frequently Asked Questions
What information can the dataset contain?
Depending on source availability, it may include product names, brands, model identifiers, displayed prices, EMI details, promotional terms, ratings, review counts, listing status, and collection timestamps.
Can the dataset track prices daily?
Yes, if the source information can be collected consistently. Each observation should retain its timestamp so analysts can distinguish actual changes from missing collection records.
Can historical prices from 2020 to 2026 be verified?
Only when dated archived pages or retained historical records are available. Current listings cannot establish past prices or financing terms by themselves.
Does EMI data show the total cost of a product?
Not necessarily. The installment amount must be evaluated alongside tenure, down payment, interest, fees, eligibility, and other disclosed conditions. Missing terms should not be assumed.
How can businesses use structured product data?
Businesses can use validated product records to compare prices, review promotional changes, analyze listing coverage, monitor disclosed financing offers, and prepare repeatable reports for pricing and category management.

 By industry🏷 By platform🌐 By market
 Pricing & Promotions
MAP Violations Brand Protection Counterfeit Detection Price Intelligence AI HOT Data Intelligence
 Brand & Intelligence
Share of Search Content Audit & PDP Reviews & Ratings Retail Media Buy Box Monitoring Social Commerce HOT Live Commerce NEW Agentic Commerce NEW
 Digital Shelf & Search
Assortment Planning Competitive Benchmarking Product Availability Q-Commerce NEW
 AssortmentE-commerce Intelligence Hyperlocal Insights POI & Store Locator DTC Brand Analytics NEW
 For Retailers
 E-Commerce Dashboard
 Flipkart Insights (Live) #1
 Grocery Intelligence
.svg) Grocery Price (U.S.)
.svg) Quick Commerce (India) HOT
 Food & Restaurant
 Fashion Intelligence
 Automotive
 Travel & Hospitality
 Real Estate
 Food Delivery Intelligence NEW
 OTT & Streaming NEW
 Fuel & EV Charging Price Tracker NEW
 By Use Case
 Pricing Intelligence
 Digital Shelf Analytics
 MAP Monitoring HOT
 Cross-Border Price Parity NEW
 Share of Search
 Review Sentiment
 Kitchen Market Gaps NEW
 Dynamic Pricing / AI Repricing NEW
 Promotions & Deals Alerts NEW
 B2B / POI & Lead Data NEW
 AI Search Visibility Dashboard NEW
 Baby Products on Quick Commerce NEW
 Hotel & Flight Rate Parity NEW
 By Region🇮🇳 India 🇺🇸 USA 🇦🇪 Middle East 🇬🇧 UK 🇦🇺 Australia 🌏 SE Asia 🇪🇺 Europe 🌎 LATAMIndia
 Flipkart Real-Time Insights
 Quick Commerce — Zepto · Blinkit
 Pincode Price Tracker
Middle East
 GCC Q-Commerce — Talabat · Noon NEW
UK & Australia
 UK Grocery — Tesco, Sainsbury's, Asda
 AU Grocery — Coles & Woolworths NEW
 Marketplace Scrapers
Amazon API TikTok Shop API HOT Uber Eats API Airbnb API Zepto / Blinkit API Instacart API NEW Talabat API NEW
 Developer APIsWeb Extract API Reviews API SERP API Pricing Webhook NEW
 Universal APIsStreaming Crawl API Scheduler Realtime Alerts Webhook Delivery 🐍 Python SDK 💚 Node.js SDK
 Delivery & SDKs
 Knowledge Center
Digital Shelf Playbook MAP Compliance Guide Pricing Intel Guide Scraping Compliance TikTok Shop Guide NEW Cross-Border Guide NEW
 Guides & Playbooks
🎉 Seasonal & event tracking NEWBlack Friday pricing report Festive season, India Ramadan, GCC grocery All seasonal reportsSample Datasets HOT ROI Calculator NEW API Postman Collection Demo Dashboards Free API Playground NEW Press Kit
 Downloads & Tools
Trust Center About Us FAQs Careers
 Trust & CompanyRetail shelf research NEWRetail shelf research


 4.8/5 Average Rating
 50+ Video Testimonials
 92% Client Retention
 50+ Countries Served