Introduction
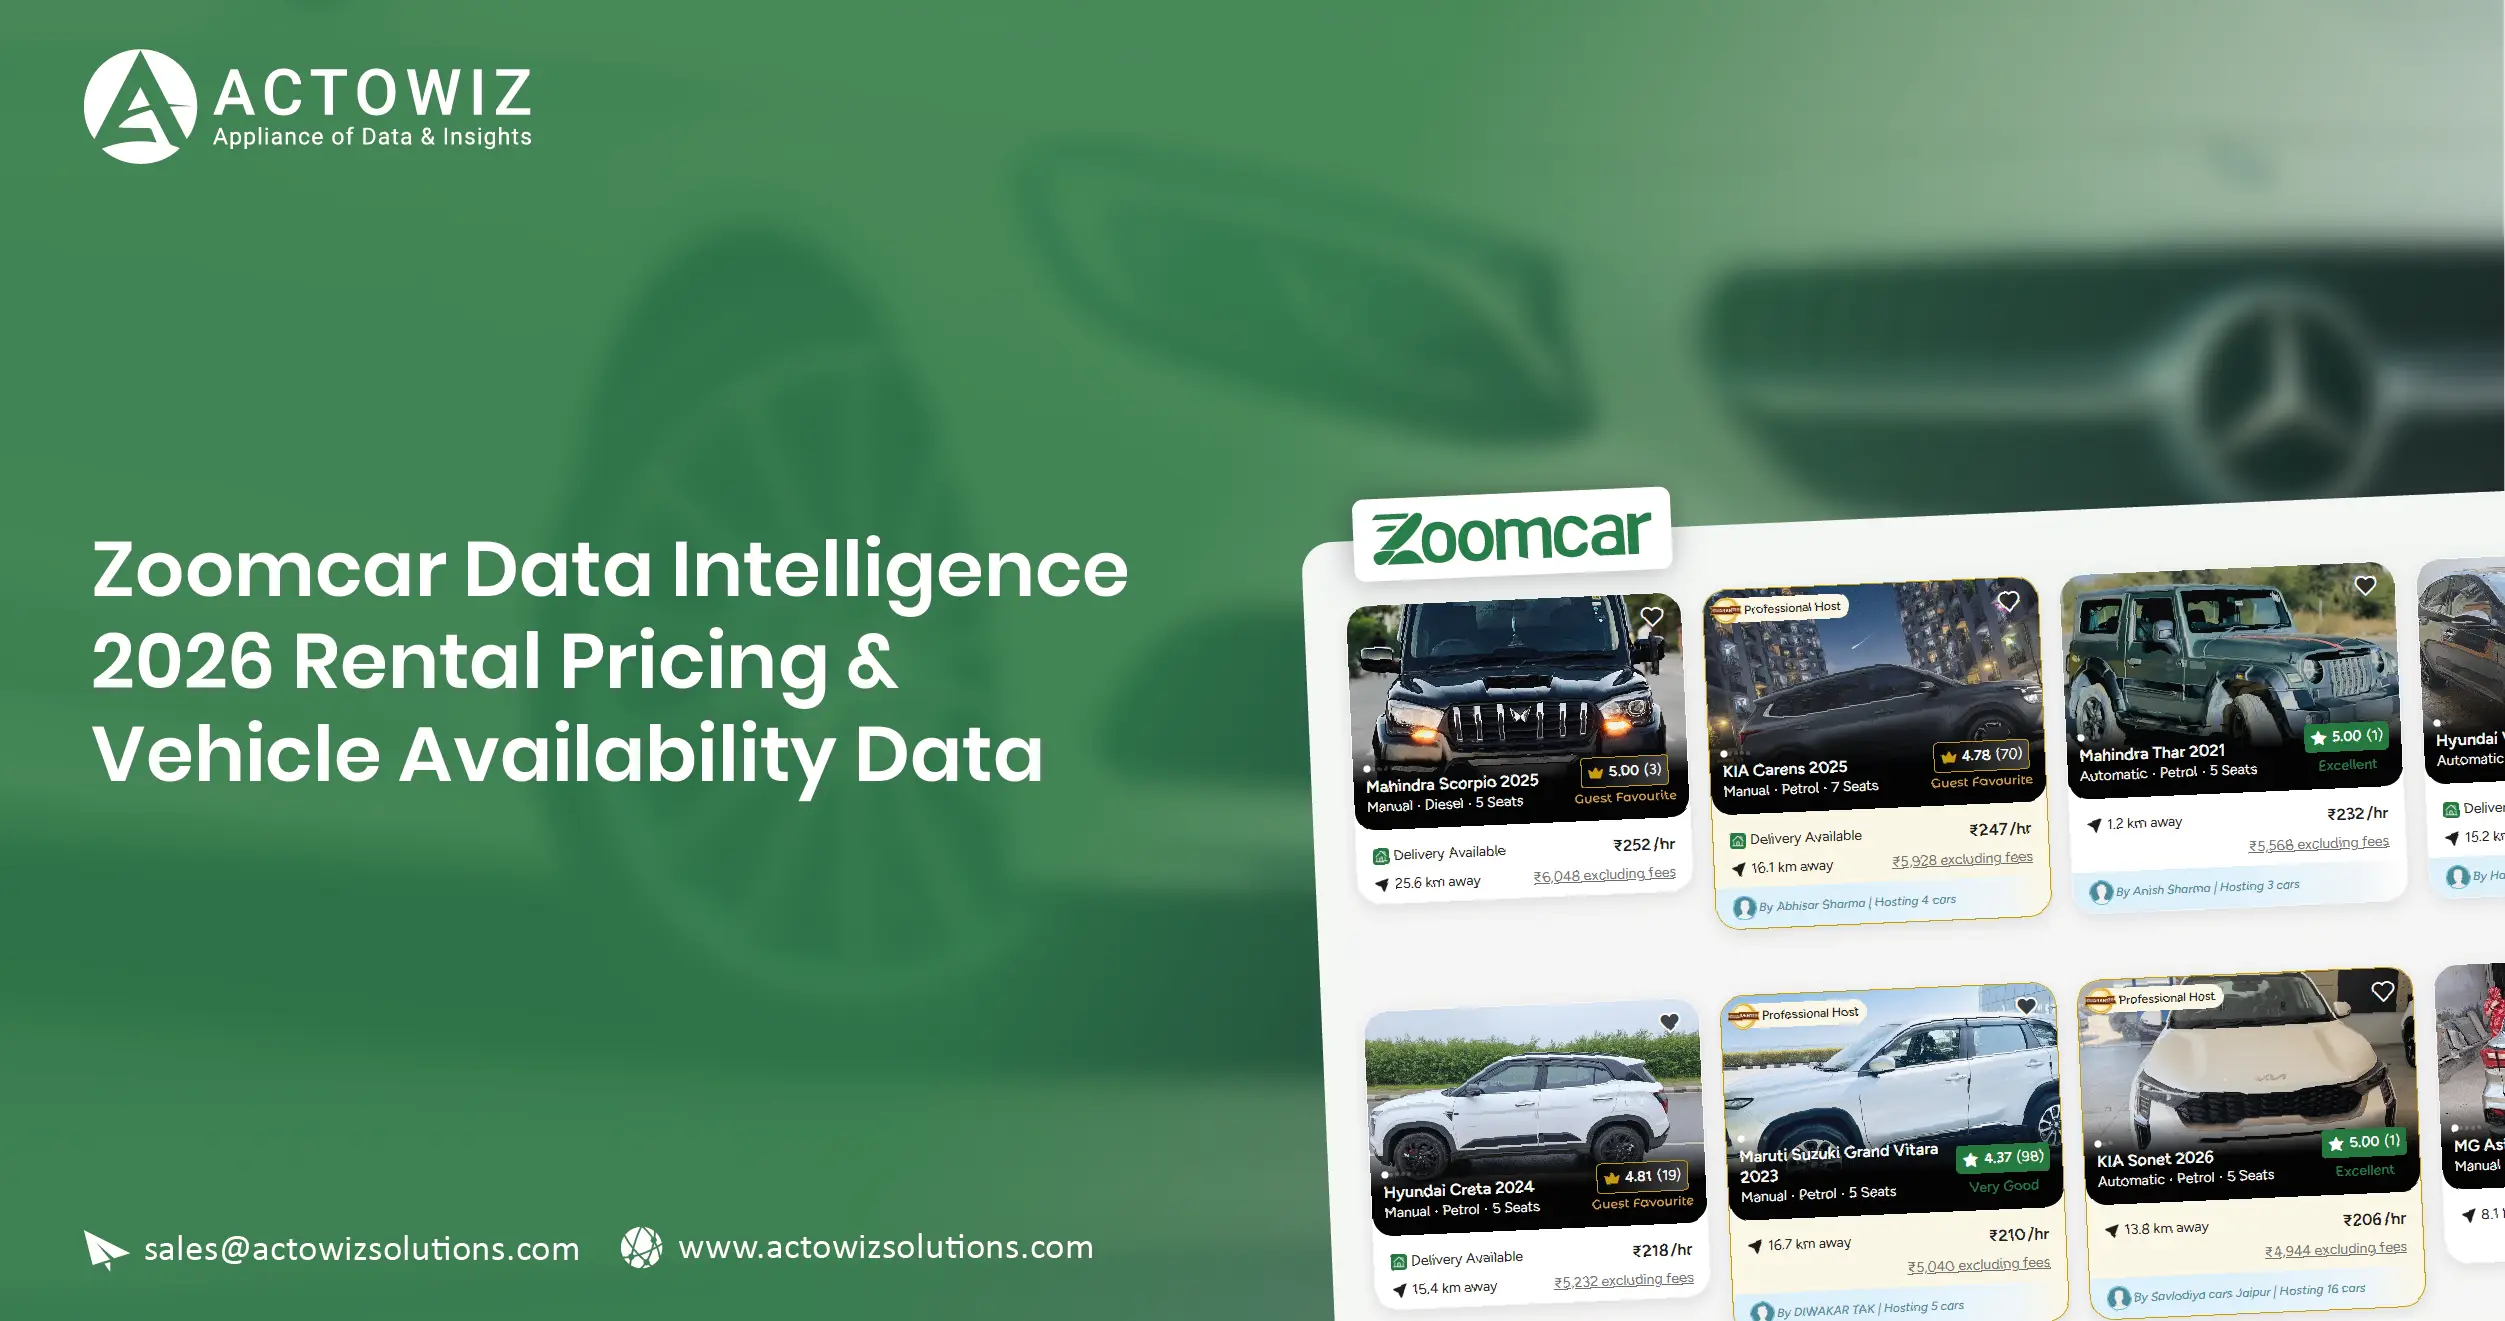
Zoomcar Data Intelligence 2026 helps mobility businesses, travel platforms, fleet operators, and market researchers understand car rental prices, vehicle availability, customer ratings, and location-based demand. By converting publicly accessible rental listings into structured datasets, businesses can compare prices, monitor available vehicles, analyze market trends, and make more informed operational decisions.
The self-drive rental market depends on several changing factors, including rental duration, vehicle type, pickup location, travel dates, seasonal demand, and host-specific pricing. When these details are distributed across online listings and mobile applications, manually comparing vehicles becomes time-consuming. Businesses can also miss price changes, overlook availability gaps, and struggle to distinguish genuine market movements from temporary listing changes.
Car Rental Data Scraping Services can help solve these problems by collecting accessible listing information, standardizing vehicle attributes, recording prices and availability observations, and organizing the information for analysis. The resulting dataset can support competitive benchmarking, demand forecasting, fleet planning, customer experience research, and rental market intelligence.
Zoomcar operates a peer-to-peer car-sharing marketplace in which vehicle owners, known as Hosts, make vehicles available to Guests through a digital platform. Its fiscal 2026 annual report states that, as of March 31, 2026, the marketplace had approximately 33,383 registered Host vehicles and 2.5 million active Guests. These figures demonstrate the scale of the platform’s marketplace activity, although they do not represent the number of vehicles available at any particular moment.
For rental businesses, the practical objective is clear: understand which vehicles are available, what they cost, how prices vary by location and date, and which market signals deserve attention.
How Can Businesses Turn Online Rental Listings Into Competitive Intelligence?
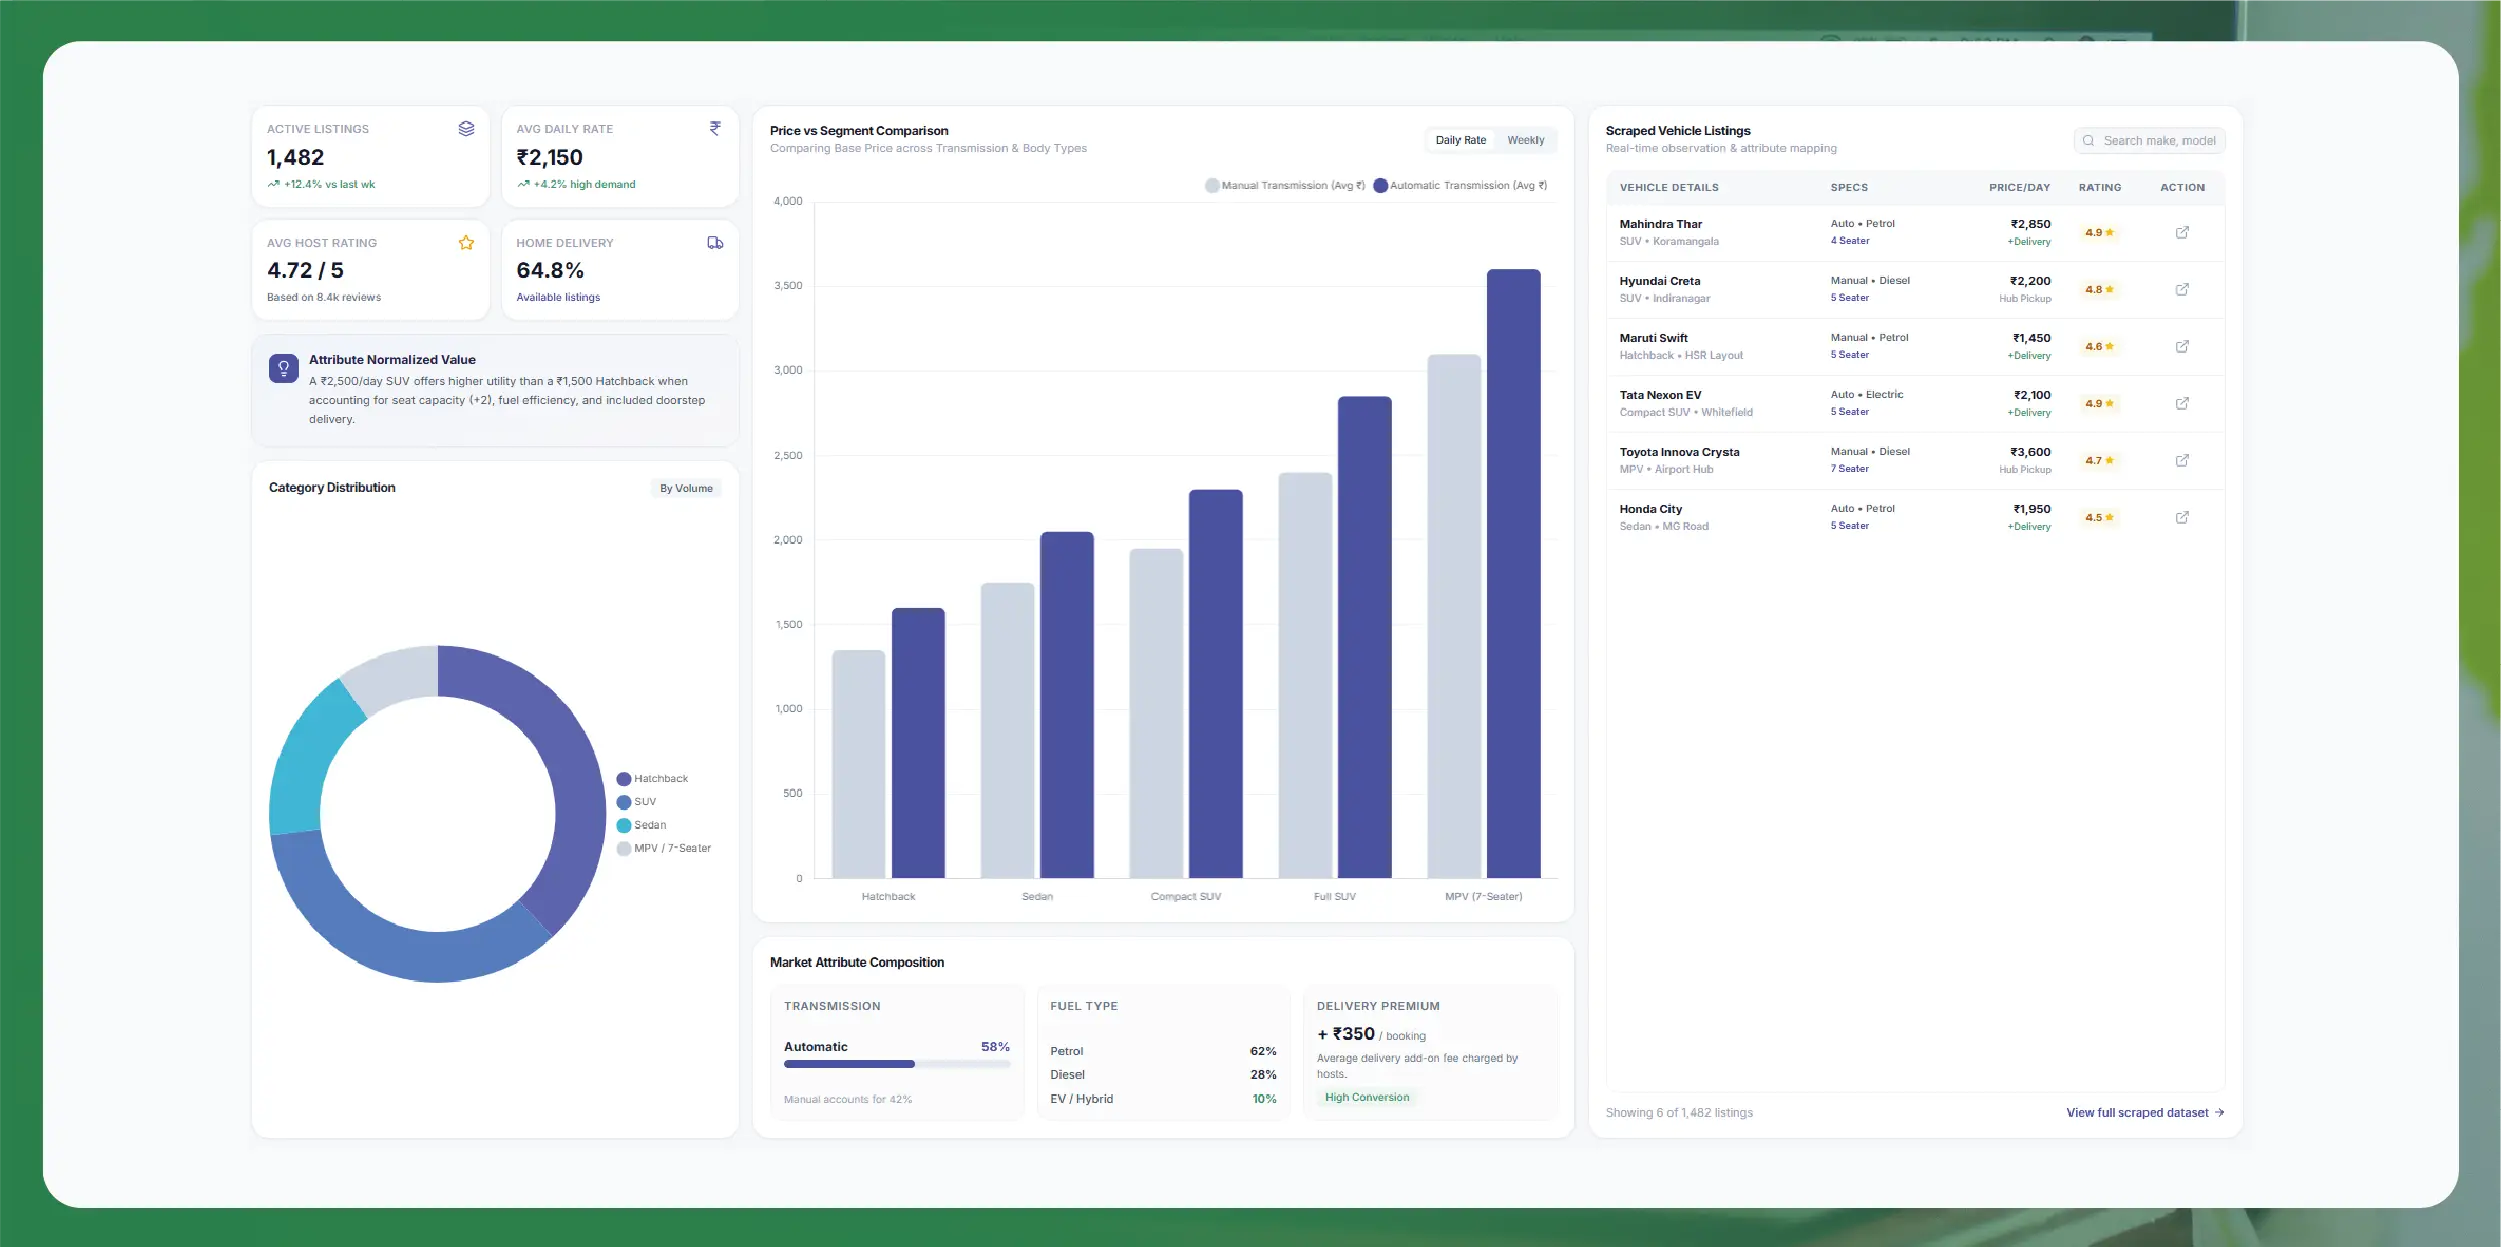
Zoomcar car rental data Scraping can help businesses collect and organize accessible information about vehicle listings, rental prices, vehicle categories, locations, and host ratings. Instead of manually checking individual listings, analysts can create a repeatable process for tracking selected vehicles and comparing market conditions across defined locations and travel periods.
A useful dataset should include more than the headline rental price. It should capture the vehicle make and model, transmission, fuel type, seating capacity, pickup location, rental duration, listed price, delivery options where available, ratings, listing URL, and observation timestamp. These attributes help analysts compare similar vehicles and avoid misleading conclusions.
For example, an SUV listed at ₹2,500 per day may appear more expensive than a hatchback listed at ₹1,500. However, the difference may reflect vehicle size, booking duration, delivery convenience, or availability during a high-demand period. A useful comparison considers these attributes rather than ranking vehicles by price alone.
What should businesses track from 2020 to 2026?
India's domestic tourism recovery provides useful context for businesses analyzing travel-related mobility demand. Government statistics record domestic tourist visits falling sharply in 2020 before recovering in subsequent years. These visits measure tourism activity, not car rental bookings, so they should be treated as a demand-context indicator rather than a direct measure of Zoomcar usage.
Digital Sansad
+1
| Year |
India's domestic tourist visits |
Business relevance |
| 2020 |
610.22 million |
Pandemic disruption created an unusual baseline |
| 2021 |
677.63 million |
Recovery remained gradual |
| 2022 |
1,731.01 million |
Increased travel activity made location monitoring more relevant |
| 2023 |
2,508.82 million |
Tourism activity recovered further |
| 2024 |
2,948.19 million |
Larger travel volumes increased the importance of market segmentation |
| 2025 |
Use the latest comparable official series |
Validate the measurement series before comparing year over year |
| 2026 |
Full-year figures are not yet available as of October |
Use current observations and label projections separately |
Source: Government of India parliamentary data on domestic tourist visits for 2020–2024. Figures are visits, not unique travelers or rental transactions.
From 2020 to 2026, the key lesson is that a historical baseline must account for exceptional disruptions and changing market conditions. Businesses should combine broader travel indicators with actual listing observations rather than assume that tourism growth translates directly into rental demand.
An effective monitoring process can help identify frequently listed vehicle types, pricing differences between comparable cars, changes in advertised availability, and locations where the observed selection is limited. These insights give travel platforms, rental operators, and mobility researchers a more consistent basis for market analysis.
How Can Rental Price Tracking Help Businesses Make Better Decisions?
Zoomcar Car rental price monitoring helps businesses record rental rates across comparable vehicles, locations, dates, and durations. A structured historical dataset can reveal whether a price difference is persistent, seasonal, or associated with a specific booking window.
The displayed price should always be interpreted in context. A two-day booking may have a different effective daily rate from a one-day booking. Delivery options, included kilometres, protection fees, taxes, deposits, and other charges can also affect the total cost. Where those details are accessible, they should be captured separately.
Which pricing indicators should analysts compare?
| Indicator |
How it helps |
| Listed rental price |
Establishes the advertised starting point |
| Effective daily rate |
Makes bookings of different durations easier to compare |
| Vehicle category |
Separates hatchbacks, sedans, SUVs, and premium vehicles |
| Booking dates |
Helps identify changes across weekdays, weekends, and holidays |
| Pickup location |
Reveals geographic price differences |
| Delivery option |
Adds context to convenience-related pricing |
| Price change percentage |
Identifies meaningful upward or downward movements |
| Total displayed charges |
Helps compare offers more fairly when available |
For example, an analyst may observe that similar SUVs have higher listed rates during a holiday weekend than on ordinary weekdays. That observation can support further investigation into seasonal pricing. It does not, by itself, prove that demand caused the increase; the analyst should also examine availability, vehicle specifications, and other relevant factors.
What do the 2020–2026 figures reveal?
Zoomcar's fiscal 2026 annual report provides comparable booking-day data for its two latest fiscal years. Booking days represent the duration of completed trips, net of cancelled booking days, and are not the same as the number of individual bookings.
| Fiscal year ended March 31 |
Booking days |
Interpretation |
| 2020–2024 |
Not included in the cited comparable figures |
Avoid inferring values without a consistent source series |
| 2025 |
678,708 |
Reported marketplace activity |
| 2026 |
743,239 |
Approximately 9.5% higher than fiscal 2025 |
| Calendar 2026 |
Full year not complete as of October |
Monitor current observations separately from fiscal-year totals |
Source: Zoomcar Holdings, Inc., fiscal 2026 Form 10-K. The percentage change is calculated from the reported booking-day totals.
The reported increase in booking days provides context for analyzing marketplace activity, but it does not establish a specific rental-price trend. Businesses should use their own dated listing observations to measure price changes and compare them with availability and vehicle attributes.
Zoomcar Data Intelligence 2026 can support this process by helping teams build consistent price histories, compare equivalent offers, flag unusual movements, and identify which changes require review. The goal is to improve the evidence available to decision-makers, not to assume that every price increase or decrease has the same cause.
How Can Vehicle Availability Data Improve Fleet and Booking Planning?
Zoomcar Car rental availability data Extraction helps businesses understand which vehicles appear available for a selected location, booking period, and rental duration. Availability is a time-sensitive attribute: a vehicle visible today may be booked tomorrow, while a car unavailable for one set of dates may be available for another.
This means that an availability dataset needs a clear timestamp and a record of the search conditions. Without these fields, analysts may compare observations that were collected for different dates or under different filters.
A useful availability record can contain:
- Vehicle identifier and listing URL.
- City or pickup area.
- Search start and end dates.
- Selected rental duration.
- Vehicle category and key attributes.
- Observed availability status.
- Listed price for the selected search.
- Collection timestamp.
- Error or confidence flag when the status is uncertain.
How can availability trends be evaluated?
A travel platform may want to know whether SUVs are consistently difficult to find in a particular destination during long weekends. A fleet operator may want to identify areas where a broader vehicle selection appears to be available. A market researcher may examine how advertised availability differs across locations.
These questions require repeated observations. A single search can establish only what was displayed for that search at that moment. It cannot establish overall fleet capacity, actual utilization, or the probability that a booking will succeed.
What does the 2020–2026 timeline mean for availability analysis?
| Period |
Market context |
Suggested analytical approach |
| 2020 |
Domestic tourism fell to 610.22 million visits |
Treat the period as an exceptional disruption |
| 2021 |
Visits increased to 677.63 million |
Compare changes cautiously against the pandemic baseline |
| 2022 |
Visits recovered to 1,731.01 million |
Expand observation coverage for key travel locations |
| 2023 |
Visits reached 2,508.82 million |
Examine location and vehicle-category differences |
| 2024 |
Visits reached 2,948.19 million |
Compare observed availability across comparable dates |
| 2025 |
Use verified, comparable market statistics |
Separate tourism measures from rental platform metrics |
| 2026 |
Monitor current date-specific availability |
Label observations by collection time and search conditions |
Domestic tourist visits are from Government of India parliamentary data. The table provides market context, not direct evidence of Zoomcar vehicle availability.
By tracking availability over repeated searches, businesses can identify patterns that warrant investigation. For example, if a vehicle category repeatedly appears unavailable in one location during high-interest periods, the result may justify further research into supply, booking restrictions, or local demand.
Teams should also distinguish “not available for the selected dates” from “listing not found,” “page failed to load,” or “availability could not be verified.” These are different states and should not be combined into a single unavailable category.
How Can Listing Data Support Vehicle and Competitor Benchmarking?
Extract Zoomcar car rental listing data to build structured comparisons of vehicle types, features, pricing, host ratings, and pickup options. Listing-level analysis helps businesses understand what customers can compare when choosing a car and which attributes differentiate similar offers.
A well-organized listing dataset should preserve both the raw observed details and the standardized fields used for analysis. This distinction is important because vehicle descriptions may vary. For example, two listings may describe the same model using different abbreviations, while different model years may share a similar display name.
Recommended data fields include:
| Data field |
Analytical use |
| Make, model, and model year where available |
Compare similar vehicles |
| Body type and seating capacity |
Segment the available selection |
| Transmission and fuel type |
Identify vehicle preferences |
| Listed price and rental duration |
Benchmark offers on a comparable basis |
| Pickup and delivery details |
Compare convenience options |
| Host or vehicle rating |
Add customer-experience context |
| Listing status |
Identify changes in the visible catalog |
| Observation date |
Maintain a historical record |
| Product or listing identifier |
Link repeated observations |
How should businesses use 2020–2026 evidence?
Zoomcar's fiscal 2026 filing describes a marketplace where Guests can search vehicles by price, location, car type, rating, and other criteria. It also describes technology features for vehicle discovery and listing management. These platform characteristics show why consistent listing attributes are useful for competitive analysis.
The filing also reports approximately 33,383 registered Host vehicles as of March 31, 2026. This is a company-reported marketplace figure, not a count of listings that will be available in every search or on every date.
| Year or period |
Data point |
How to interpret it |
| 2020–2024 |
Domestic tourism experienced disruption and recovery |
Use as broad market context |
| Fiscal 2025 |
678,708 booking days |
Historical platform activity |
| Fiscal 2026 |
743,239 booking days |
A comparable measure of completed trip duration |
| March 31, 2026 |
Approximately 33,383 registered Host vehicles |
Reported marketplace scale, not live inventory |
| October 2026 |
Current listings require date-specific observation |
Collect current data and label the timestamp |
Businesses can use these datasets to compare vehicle-category representation, advertised prices, listing characteristics, and rating distributions. They should avoid equating the number of observed listings with actual fleet size or interpreting a listing change as proof that a vehicle has been permanently added or removed.
A useful benchmark report should answer three questions: which vehicles are comparable, how do their advertised terms differ, and which differences are relevant to the intended customer or business decision?
How Can City-Level Insights Reveal Local Rental Opportunities?
City-wise car rental availability data from Zoomcar can help businesses compare the visible vehicle selection, advertised rental prices, and vehicle categories across locations. City-level analysis matters because a market-wide average may conceal meaningful differences between business districts, airports, residential areas, and popular weekend destinations.
For a useful comparison, businesses should standardize the search conditions across cities. The same vehicle category, rental duration, booking dates, and pickup requirements should be used wherever possible. Otherwise, a difference between two cities may reflect different search settings rather than an actual market difference.
Which city-level indicators are useful?
| Indicator |
Why it matters |
| Number of vehicles observed |
Measures the visible selection for a defined search |
| Median advertised price |
Reduces the influence of unusually high or low listings |
| Price range by category |
Shows the spread of advertised options |
| Availability by requested dates |
Identifies where a search returns fewer options |
| Vehicle-category distribution |
Shows the types of cars visible in the sample |
| Delivery or pickup options |
Adds context to customer convenience |
| Rating distribution |
Helps compare visible customer feedback |
| Observation frequency |
Indicates how reliably trends can be monitored |
What changed from 2020 to 2026?
Government of India figures show domestic tourist visits rising from 610.22 million in 2020 to 2,948.19 million in 2024. This broad recovery provides a reason to examine location-specific mobility patterns, but tourist visits cannot identify the cities or dates when Zoomcar rentals will be most in demand.
| Year |
Domestic tourist visits |
Implication for research |
| 2020 |
610.22 million |
Establish a disruption-period baseline |
| 2021 |
677.63 million |
Observe gradual recovery |
| 2022 |
1,731.01 million |
Increase attention to regional differences |
| 2023 |
2,508.82 million |
Compare major destinations and travel periods |
| 2024 |
2,948.19 million |
Expand date-specific location analysis |
| 2025 |
Use a consistent official series |
Avoid mixing incompatible estimates |
| 2026 |
Full-year results are not yet available |
Use current, time-stamped observations |
City-level insights can support decisions such as which locations deserve deeper research, where advertised vehicle selection appears limited, and where price differences justify further investigation. They can also help rental businesses design localized promotions and assess potential vehicle supply gaps.
However, a city comparison should not be interpreted as a complete market-share report. It reflects the vehicles visible through the selected source, search conditions, and observation window. Broader conclusions require additional data and a clear methodology.
How Can Ratings and Reviews Help Explain Customer Preferences?
Zoomcar Car Rental Reviews & Rating Dataset can help businesses analyze the relationship between visible customer feedback, vehicle attributes, and listing performance. Rental decisions involve more than price. Customers may also consider vehicle condition, host communication, pickup convenience, cleanliness, and the reliability of the overall experience.
A structured review dataset can include the displayed rating, review count where available, review date, vehicle or host identifier, and publicly visible review text where collection is permitted. Text analysis can then group feedback into themes, such as vehicle condition, convenience, communication, and value for money.
What should businesses measure?
| Metric |
Potential use |
| Average displayed rating |
Compare visible customer evaluations |
| Review count |
Understand how much feedback supports a rating |
| Rating distribution |
Identify whether feedback is concentrated or mixed |
| Common positive themes |
Understand perceived strengths |
| Common complaint themes |
Identify areas requiring further research |
| Review date |
Track how feedback changes over time |
| Vehicle or host identifier |
Connect feedback to the appropriate listing |
| Sentiment category |
Summarize recurring feedback themes |
Rating comparisons should be handled carefully. A vehicle with a 4.9 rating from a small number of reviews may not be directly comparable to one with a 4.7 rating from many reviews. Review text can also be subjective, and automated sentiment classification should be checked for errors, sarcasm, and context.
What does the 2020–2026 evidence suggest?
Zoomcar's fiscal 2026 annual report explains that Guest ratings and reviews form part of its marketplace experience. The filing also describes ranking features and ratings-related incentives, making customer feedback a relevant attribute for marketplace research.
The report states that Zoomcar had approximately 2.5 million active Guests as of March 31, 2026. This is a measure of users who searched the platform for vehicles or bookings during the preceding 12 months, not the number of completed trips or people who left reviews.
| Period |
Available evidence |
Research implication |
| 2020–2022 |
Historical tourism conditions changed significantly |
Compare feedback with appropriate market context |
| 2023–2024 |
Domestic tourism recovered |
Analyze feedback by destination and vehicle type where data permits |
| Fiscal 2025 |
678,708 booking days |
Platform activity provides operational context |
| Fiscal 2026 |
743,239 booking days and approximately 2.5 million active Guests |
Review data can be examined alongside broader marketplace indicators |
| Calendar 2026 |
Full-year results are not yet available |
Continue collecting dated observations |
Businesses can use this information to identify recurring customer concerns, compare feedback patterns across vehicle categories, and investigate whether particular listing attributes are associated with stronger ratings. These are analytical questions rather than guaranteed causal relationships.
The dataset should preserve review context and collection dates, avoid exposing personal information, and follow applicable platform terms. When review text is unavailable or collection is not permitted, aggregate ratings and other accessible attributes may still support some forms of analysis.
How Can Actowiz Solutions Help Businesses Build a Rental Intelligence Workflow?
Actowiz Solutions can help businesses plan structured data collection and analysis workflows for rental listings, pricing, availability, and customer feedback. The objective is to deliver consistent, validated data that fits the client’s operational and analytical requirements.
With Zoomcar data extraction, businesses can define which listing attributes to monitor, which locations and vehicle categories matter, how often observations should be collected, and how the resulting data will be used. The exact collection scope depends on technical feasibility, source accessibility, applicable terms, and privacy requirements.
Actowiz Solutions can support the process through:
- Custom data collection: Capture permitted, publicly accessible rental listing information according to the project scope.
- Price standardization: Normalize currencies, rental durations, and comparable pricing fields.
- Availability tracking: Preserve date-specific observations and distinguish unavailable results from collection failures.
- Listing normalization: Standardize vehicle names, categories, fuel types, and other relevant attributes.
- Historical dataset creation: Store dated records for trend analysis and comparisons.
- Review and rating analysis: Structure accessible feedback fields for aggregate analysis.
- Data validation: Flag duplicates, missing fields, inconsistent product matches, and anomalous price changes.
- Flexible delivery: Provide structured files, databases, or analytics-ready outputs according to project requirements.
What does a practical implementation plan look like?
| Phase |
Deliverable |
Business outcome |
| Discovery |
Target locations, fields, and vehicle categories |
Clear scope and priorities |
| Collection design |
Source and refresh plan |
Repeatable observation process |
| Data processing |
Standardized listings and prices |
More reliable comparisons |
| Validation |
Quality checks and exception flags |
Reduced risk of misleading insights |
| Analysis |
Price, availability, and review indicators |
Actionable competitive intelligence |
| Delivery |
Dataset or reporting-ready output |
Easier integration into business workflows |
A successful project should be measured against agreed KPIs. Examples include listing-field completeness, product-match accuracy, collection success rate, availability-observation consistency, and the time required to detect a meaningful price change. These metrics provide a transparent way to evaluate data quality and operational value.
Actowiz Solutions can also help teams design dashboards or recurring reports that connect observed listing data to business questions. For example, a travel platform may monitor prices for selected vehicle categories across major cities, while a market research firm may prioritize historical pricing and customer feedback. The monitoring plan should reflect the decision the business needs to make, not merely maximize the number of records collected.
Conclusion
Car rental businesses need reliable information to understand changing prices, vehicle availability, local market differences, and customer preferences. Manual research can become difficult to maintain when listings change frequently and search results depend on location, dates, and vehicle requirements.
Zoomcar Data Intelligence 2026 offers a framework for organizing these signals into structured market intelligence. By combining price comparisons, time-stamped availability observations, listing attributes, and accessible customer feedback, businesses can develop a clearer view of the rental marketplace and make more informed decisions.
Actowiz Solutions can help businesses develop tailored workflows using AI-Powered Scraping, Web Scraping, Mobile App Scraping, and a structured Real-time dataset approach where source capabilities and project requirements support it. Collection frequency, coverage, and analytical depth should be defined around business objectives and data quality requirements.
Ready to improve your car rental market intelligence? Contact Actowiz Solutions to discuss a tailored data collection solution for pricing, vehicle availability, and rental market analysis.
You can also reach us for all your mobile app scraping, data collection, web scraping, and instant data scraper service requirements!

 By industry🏷 By platform🌐 By market
 Pricing & Promotions
MAP Violations Brand Protection Counterfeit Detection Price Intelligence AI HOT Data Intelligence
 Brand & Intelligence
Share of Search Content Audit & PDP Reviews & Ratings Retail Media Buy Box Monitoring Social Commerce HOT Live Commerce NEW Agentic Commerce NEW
 Digital Shelf & Search
Assortment Planning Competitive Benchmarking Product Availability Q-Commerce NEW
 AssortmentE-commerce Intelligence Hyperlocal Insights POI & Store Locator DTC Brand Analytics NEW
 For Retailers
 E-Commerce Dashboard
 Flipkart Insights (Live) #1
 Grocery Intelligence
.svg) Grocery Price (U.S.)
.svg) Quick Commerce (India) HOT
 Food & Restaurant
 Fashion Intelligence
 Automotive
 Travel & Hospitality
 Real Estate
 Food Delivery Intelligence NEW
 OTT & Streaming NEW
 Fuel & EV Charging Price Tracker NEW
 By Use Case
 Pricing Intelligence
 Digital Shelf Analytics
 MAP Monitoring HOT
 Cross-Border Price Parity NEW
 Share of Search
 Review Sentiment
 Kitchen Market Gaps NEW
 Dynamic Pricing / AI Repricing NEW
 Promotions & Deals Alerts NEW
 B2B / POI & Lead Data NEW
 AI Search Visibility Dashboard NEW
 Baby Products on Quick Commerce NEW
 Hotel & Flight Rate Parity NEW
 By Region🇮🇳 India 🇺🇸 USA 🇦🇪 Middle East 🇬🇧 UK 🇦🇺 Australia 🌏 SE Asia 🇪🇺 Europe 🌎 LATAMIndia
 Flipkart Real-Time Insights
 Quick Commerce — Zepto · Blinkit
 Pincode Price Tracker
Middle East
 GCC Q-Commerce — Talabat · Noon NEW
UK & Australia
 UK Grocery — Tesco, Sainsbury's, Asda
 AU Grocery — Coles & Woolworths NEW
 Marketplace Scrapers
Amazon API TikTok Shop API HOT Uber Eats API Airbnb API Zepto / Blinkit API Instacart API NEW Talabat API NEW
 Developer APIsWeb Extract API Reviews API SERP API Pricing Webhook NEW
 Universal APIsStreaming Crawl API Scheduler Realtime Alerts Webhook Delivery 🐍 Python SDK 💚 Node.js SDK
 Delivery & SDKs
 Knowledge Center
Digital Shelf Playbook MAP Compliance Guide Pricing Intel Guide Scraping Compliance TikTok Shop Guide NEW Cross-Border Guide NEW
 Guides & Playbooks
🎉 Seasonal & event tracking NEWBlack Friday pricing report Festive season, India Ramadan, GCC grocery All seasonal reportsSample Datasets HOT ROI Calculator NEW API Postman Collection Demo Dashboards Free API Playground NEW Press Kit
 Downloads & Tools
Trust Center About Us FAQs Careers
 Trust & CompanyRetail shelf research NEWRetail shelf research


 4.8/5 Average Rating
 50+ Video Testimonials
 92% Client Retention
 50+ Countries Served