Core services
Enterprise Data Extraction

Scalable web, app and AI-powered collection across 40+ countries.

All 58 services →
New 2026
AI Training Data

Corpus building with provenance and opt-out compliance.

Learn more →
Free pilot
24-hour sample

We run collection on your own sources before you commit.

Get a sample →
58Services
40+Countries
DEVELOPER

Ready-Made Scrapers

Pre-built for top platforms. Self-serve, no setup.

View All →
TRY FREE

API Playground

Test endpoints instantly. No credit card.

Start Free →
28Tools
2SDKs
icons Delivery & SDKs
Streaming Crawl API Scheduler Realtime Alerts Webhook Delivery 🐍 Python SDK 💚 Node.js SDK
Need it managed instead?

Fixed monthly retainer, named engineer, no per-request metering.

Managed Data API →
HOT

Case Studies

How brands use Actowiz, with named outcomes.

Read →
FREE

Sample Datasets

Real output, no signup.

Download →
NEW

ROI Calculator

Model the return on a data engagement.

Calculate →
Coverage · India

Pincode-level coverage in metro India

Almost every Indian quick-commerce request arrives asking for 'all pincodes in Delhi'. That is usually the wrong scope, and it is worth explaining why before quoting for it.

In Indian quick commerce, the pincode is the unit of analysis, not the city. Price, assortment and availability all vary by pincode because each dark store carries what its catchment buys. A city-level figure describes no actual shopper. The design question is therefore not which pincodes but how many, chosen how, and what the panel represents.

Almost every Indian quick-commerce request arrives asking for 'all pincodes in Delhi'. That is usually the wrong scope, and it is worth explaining why before quoting for it.

Free pilot on your own sources, returned in 24 hours. No card, no trial clock — and you keep the sample data either way.

Panel designed with you, stated in writing Serviceability as its own state Held fixed, so months stay comparable
india_panel_design.json LIVE FEED
// what a panel proposal looks like, not a data sample {"city": "Delhi NCR", "pincodes_in_metro": 318, "pincodes_in_panel": 42, "selection_basis": "catchment_type_stratified", "catchment_types": ["dense_metro", "affluent_residential", "mixed_residential", "suburban_edge"], "platforms": 5, "panel_is_shared_across_platforms": true, "represents": "variation across catchment types in this metro", "does_not_represent": "every pincode; tier-2 behaviour; rural", "panel_fixed_from": "2026-09-01", "change_policy": "additions logged, existing points never removed silently"}
the panel proposal, issued before a quotewhat it covers, and what it does not
Our Data Powers
B2C Marketplace
amazon
D2C + Marketplace
NYKAA
D2C + Marketplace
Walmart
FMCG Marketplace
udaan
Food Delivery
Uber Eats
Quick Commerce
blinkit
Taxi Aggregator
Uber
E-Commerce
Tmall

Key facts at a glance

The unit
Pincode. Not city, not state, not national
Why
Each dark store carries what its catchment buys
The usual request
'All pincodes in Delhi' — usually the wrong scope
What we propose instead
A stratified panel, with what it represents stated
Shared across platforms
One panel for all five, or the comparison is invalid
Serviceability
Its own state, distinct from an item being out of stock
Cost driver
Pincodes × SKUs × observations. Pincode count dominates
Panel stability
Fixed once agreed. Additions logged, points never removed silently
1panel shared across all platformsor the cross-platform comparison is invalid
2availability states, always separatedserviceable and in stock
0panels changed without a logged entrya moving panel breaks a series silently
24hfree pilot on your own pincodesbefore the panel is fixed

Key takeaways

  • The unit: Pincode. Not city, not state, not national
  • Why: Each dark store carries what its catchment buys
  • The usual request: 'All pincodes in Delhi' — usually the wrong scope
  • What we propose instead: A stratified panel, with what it represents stated
  • Shared across platforms: One panel for all five, or the comparison is invalid
  • Serviceability: Its own state, distinct from an item being out of stock

Last verified 5 August 2026 by the Actowiz Solutions Data Engineering team.

Definition

Why an exhaustive sweep is usually the wrong answer

The instinct is reasonable: if assortment varies by pincode, cover every pincode. In practice that is expensive and frequently no more informative.

What actually varies

Pincodes within the same catchment type tend to behave similarly. Two dense-metro pincodes three kilometres apart usually carry comparable assortment at comparable prices. The variation that matters is between catchment types — dense metro against suburban edge, affluent residential against mixed.

A stratified panel covering each catchment type with several points captures that variation. An exhaustive sweep captures it too, plus a great deal of redundancy, at several times the cost.

The arithmetic

Cost scales with pincodes × SKUs × observations per day. A metro with 300 pincodes, 2,000 SKUs and two daily observations is 1.2 million observations per day before you add a second platform. A 42-pincode panel on the same SKUs is a seventh of that.

What we owe you in exchange

A written statement of what the panel represents and what it does not. Our proposals carry represents and does_not_represent as explicit fields, because a sample is only defensible if its limits are stated.

If your analysis genuinely needs every pincode — a coverage-obligation question, say, rather than a pricing one — we will build it. We would just rather you chose that deliberately than by default.

The design decisions

Six things a pincode panel has to get right

Each of these has broken a real engagement when it was skipped.

Catchment stratification

The basis for choosing points.

  • Dense metro, affluent residential, mixed, suburban edge
  • Several points per type rather than many in one

  • Selection basis recorded in the proposal
  • Tier-two cities designed separately, not as more metro points

One panel across platforms

Or the comparison is not a comparison.

  • The same pincodes on Blinkit, Zepto, Instamart, Flipkart Minutes and Amazon Now
  • The same observation schedule across all five
  • Records comparable by construction rather than after reconciliation
  • Adding a sixth platform uses the existing panel

Serviceability as its own state

The most common conflation.

  • A pincode outside a delivery radius is not a stockout
  • Conflating them understates coverage gaps and overstates stockouts
  • Recorded separately on every observation
  • Serviceability changes as networks expand — it is a signal in itself

Observation schedule

Availability moves within the day.

  • Multiple observations where availability is the question
  • Fewer where price is the question and price moves slowly
  • Schedule stated, so a series is interpretable
  • Tiering by SKU priority rather than one rate for everything

Panel stability

A moving panel breaks a series silently.

  • Fixed from an agreed date
  • Additions logged with the date they entered
  • Points never removed without a logged entry
  • So a month-on-month move is the market, not the panel

Stated representativeness

What the sample can and cannot support.

  • represents and does_not_represent as explicit fields
  • Issued with the proposal, before a quote
  • Carried into the delivered data
  • So an analyst inheriting the service knows its basis
Service scope

What the ecommerce data scraping service includes

A managed engagement, not a tool licence. We own the pipeline and everything that breaks in it.

✓ Included in every engagement

  • Stratified panel design with the selection basis recorded
  • One panel shared across all platforms in scope
  • Serviceability kept as a distinct state from stock
  • Panel fixed from an agreed date, with additions logged
  • Stated representativeness carried into the delivered data
  • Non-serviceable observations retained rather than dropped
  • Source discovery, scoping and a written collection plan
  • Free pilot on your own sources before any commitment

  • Full pipeline build, hosting and proxy infrastructure
  • Schema design, validation and sampled human QA on every run
  • Ongoing maintenance when source layouts change — our cost, not yours
  • Delivery to your warehouse, bucket, SFTP or API endpoint
  • Documented methodology and compliance notes for your legal review

× Not included — stated upfront

  • A claim about pincodes outside the panel
  • Dark store counts or locations inferred from serviceability
  • A panel changed without a logged entry
  • Personal data of any kind, including addresses of individuals
  • Anything behind a login, paywall or credentialed session
  • Personal data beyond a documented lawful basis
  • Licensed third-party datasets we do not hold rights to
  • Guarantees about fields a source simply does not publish
Schema

What travels with every observation

The geographic fields. Product fields are on the individual platform pages.

Geographic fields, India pincode panel
Field Type What it captures Refresh
pincode string Mandatory on every record. The unit of analysis Every record
city / metro string The metro the pincode belongs to Every record
catchment_type string Why this pincode is in the panel Every record
panel_id / panel_version string Which panel, and which version of it Every record
serviceable boolean Whether the platform delivers here at all Every record
in_stock boolean Null where not serviceable, since the question does not arise Where serviceable
dark_store_id string Where the platform exposes it Where exposed
platform string So one panel serves all platforms Every record
observed_at timestamp Required, because availability moves within the day Every record
panel_entered_at date When this pincode joined the panel Every record
represents_note string Carried from the proposal into the data Per batch

panel_version and panel_entered_at exist so that a series can be filtered to points present throughout a period. Without them, a panel that grew mid-series looks like a market that grew.

Coverage

Where pincode-level design applies

Not only quick commerce, though that is where it matters most.

Quick commerce — Blinkit, Zepto, Instamart, Flipkart Minutes, Amazon NowFood delivery — Swiggy, Zomato at delivery-area levelOnline pharmacy and medicine deliveryScheduled grocery — BigBasket, JioMartRide-hailing fare panels at route levelQ-commerce fee and promise variationServiceability mapping as networks expandTier-two city entry assessmentFestive and seasonal availability trackingDark-store network inference from serviceability

The last one is worth noting. Serviceability across a panel over time is the cheapest available signal on where a platform is opening or closing dark stores, and it is an observation rather than an inference about store counts. Request a source we don't list →

Markets served

Countries and markets where this service is in highest demand

We deliver into 40+ countries. These are the markets where this particular service is requested most, and the reason demand concentrates there.

Highest-demand markets for this service, and why demand concentrates there
Market Why demand concentrates here

North America

United StatesCanadaMexico

United Kingdom & Ireland

United KingdomIreland

Western Europe

GermanyFranceNetherlandsBelgiumSpainItalySwitzerlandAustria

Nordics

SwedenNorwayDenmarkFinland

Middle East

United Arab EmiratesSaudi ArabiaQatarKuwaitIsrael

Asia Pacific

SingaporeAustraliaNew ZealandJapanSouth KoreaMalaysiaIndonesiaThailandVietnamPhilippines

South Asia

IndiaBangladeshSri LankaPakistan

LATAM

BrazilArgentinaChileColombia

Africa

South AfricaNigeriaKenyaEgypt

We run production collection across 40+ countries. Coverage depth varies by market and by source, so we confirm what is actually available for your specific markets during scoping rather than claiming uniform global coverage. Ask about a market we don't list →

Who buys this data

Who this matters to

Mostly people who have been burned by a city-level number.

Category or Pricing Manager

FMCG and consumer brands
The problem

A national price index that no shopper experiences is worse than none.

What we deliver

A stratified panel with its representativeness stated.

Metric that moves

Index defensibility

Head of Sales

FMCG
The problem

Needs to know where the brand is ranged and where it is not.

What we deliver

Assortment by pincode with serviceability separated from stockouts.

Metric that moves

Distribution visibility

Trade Marketing Lead

Consumer brands
The problem

Promotional intensity concentrates geographically and a national view hides it.

What we deliver

Mechanics by catchment type rather than averaged.

Metric that moves

Spend targeting

Founder / Product Lead

Startups building on the data
The problem

Needs to know what a panel supports before promising it to users.

What we deliver

represents and does_not_represent carried into the service.

Metric that moves

Claim accuracy

Supply Chain Lead

Retail and D2C
The problem

Serviceability expansion signals where demand is being unlocked.

What we deliver

Serviceability over time across a fixed panel.

Metric that moves

Network planning

Analyst

Consultancies and investors
The problem

Inherits feeds and has to defend their basis.

What we deliver

Panel version and entry dates, so a series can be filtered to stable points.

Metric that moves

Series integrity

Use cases

What a well-designed panel supports

And, in the last case, what it deliberately does not.

Cross-platform price comparison that holds

One panel and one schedule across all five Indian quick-commerce platforms, so a price difference is a price difference rather than an artefact of two different pincode sets.

Outcome: A comparison that survives scrutiny.

Assortment gaps by catchment type

Which SKUs are ranged in dense metro versus suburban edge, with serviceability separated so a coverage gap is not read as a sell-out.

Outcome: Distribution decisions on the right geography.

Serviceability expansion as a network signal

A fixed panel observed over time shows where a platform started or stopped serving, before any announcement and without inferring store counts.

Outcome: Early sight of network movement.

What it does not support

A claim about pincodes outside the panel. The proposal states this and the field travels with the data, so nobody downstream extrapolates a stratified sample into a census.

Outcome: An honest limit, stated upfront.

Engagement examples

Two engagements, anonymised

Clients rarely permit naming. These are real engagement shapes with identifying detail removed, so you can judge whether the work resembles your situation.

Examples are anonymised at client request. Named references are available on request under NDA. See published case studies →

The 24-hour sample — run on your sources, not ours

Before you commit to anything, we run this service against your own sources and send you the output. If the coverage isn't there, the sample will show you that too — which is the point. We would rather lose the deal at the pilot than at month three.

  • Real extraction from your actual sources
  • Returned within 24 hours
  • Coverage and QA note included
  • You keep the data either way
  • No card, no trial clock
  • Named engineer on the call
Get my free sample Book a 20-min scoping call Reply within one business day. Reference calls available under NDA.
How we engage

Three ways to engage us

Same collection pipeline and QA underneath. The difference is who holds the schedule and how the data reaches you.

Managed service (most common)

We own the collection, the QA and the delivery. You receive clean data on a schedule and never touch a scraper.

  • Dedicated engineer assigned to your account
  • Site changes fixed by us, not reported to you
  • Scheduled delivery to your warehouse or S3
  • Named contact on Slack or email

Best fit: Teams who need the data, not the infrastructure.

API access

The same collection pipeline exposed as an authenticated REST endpoint your systems query directly.

  • On-demand and scheduled endpoints
  • Rate limits agreed to your load profile
  • Sandbox keys for integration testing
  • Versioned schema with deprecation notice

Best fit: Product and engineering teams building on live data.

One-time or project extraction

A defined pull for a specific question — market sizing, diligence, a pitch, a one-off audit.

  • Fixed scope agreed in writing upfront
  • Single delivery with full QA report
  • Methodology documented for your records
  • Converts to managed if you want continuity

Best fit: Research, strategy and diligence work with a deadline.

Pricing

Every engagement is quoted individually, because the honest answer depends on your scope: how many sources, how many records, how often, and how the data reaches you. We scope it with you, run a free pilot on your own sources, and then quote a fixed monthly figure — no per-request metering and no overage billing when volumes move. Request a quote and you will have a number after one call.

Build vs buy

Sweep every pincode, or design a panel?

Both are legitimate. One is usually chosen by default rather than on purpose.

In-house build vs self-serve tool vs Actowiz managed service
Consideration In-house scraping team Generic proxy / DIY tool Actowiz managed feed
Time to first usable data 6–12 weeks of engineering before anything is trustworthy Days, but output needs manual cleanup before use Free pilot in 24 hours, production in 5–10 business days
Who fixes it when a source changes Your engineers, at the cost of their roadmap You do — tools report failures, they don't resolve them We do, same business day, inside the retainer
Data quality assurance Whatever your team has time to build None beyond HTTP success Schema validation plus sampled human QA on every run
Compliance documentation Rarely produced, then requested urgently by legal Not provided; terms risk sits with you Sources, method and lawful basis documented for review
Accountability Distributed across a team with other priorities A support ticket queue A named engineer and an account owner
True annual cost Engineer salaries, proxies, hosting, ongoing maintenance Low licence fee plus significant hidden analyst time One fixed monthly retainer, quoted after scoping

Serviceability is a signal, not just a filter

Most feeds treat serviceability as something to filter out — if a platform does not deliver to a pincode, drop the row. That discards one of the more useful things a pincode panel produces.

  • Serviceability changes as networks expand or contract. A pincode becoming serviceable is a dark store opening nearby.
  • It changes faster than assortment does, so it is an earlier signal.
  • It is an observation, unlike store counts, which have to be inferred.

We keep non-serviceable observations as rows with serviceable: false and in_stock: null, rather than dropping them. That way the transition from unserved to served is visible in the series.

What we do not do is convert that into a store count. A pincode becoming serviceable tells you a facility can reach it; it does not tell you how many facilities exist or where they are.

One thing worth knowing about delivery promises in India

In early 2026 the Indian government restricted the use of the "ten-minute delivery" advertising claim, on safety and labour grounds. Platforms adjusted how they present delivery times in response.

Why this matters for a series

A change in the displayed promise may reflect a presentation change rather than an operational one. A promise that moved from "10 mins" to a range, or to softer wording, is not evidence that fulfilment slowed.

Our newer India pages capture promise_text_raw alongside any parsed minutes value, so a rewording stays visible as a rewording. If you hold a series that predates that change, it contains a break, and it is worth identifying rather than reading through.

This is a good example of why panel and schedule metadata matter generally: without the raw text, a field that changed for regulatory reasons becomes indistinguishable from a field that changed for operational ones.

How it works

How a pincode panel gets designed

The panel proposal comes before the quote.

Tell us the cities and the catchment types, not the pincode list

Which catchments matter — dense metro, suburban, tier-two — decides the panel. A pincode list is the output of that conversation, not the input.

We propose a panel and state what it represents

How many pincodes, chosen how, and what the panel does and does not cover. In writing, before a quote.

Free pilot within 24 hours on your own SKUs and pincodes

Real extraction, so you see actual serviceability and assortment variation rather than a description of it.

Agree the panel and hold it

Once fixed, it does not move. A panel that changes between months makes the months incomparable and nothing in the data says so.

Review at 30 days

Panels are worth revisiting once you see the variation. Adding two pincodes that turn out to matter beats sweeping forty that do not.

Formats & destinations

Geographic fields travel with the product data in whatever format is agreed. The panel proposal is supplied as a document before quoting.

Compliance & data ethics

Pincode is a geographic identifier, not personal data. We collect no personal data in any market, and a panel identifies delivery areas rather than individuals or addresses of individuals.

Service commitments

What we commit to, in writing

These are contractual, not marketing copy. They appear in the engagement document.

Service level commitments written into every managed engagement
Commitment What we hold ourselves to
Pilot turnaround A real sample from your own sources within 24 hours of scoping, at no cost.
Go-live Production collection running within 5–10 business days of sign-off.
Delivery punctuality 99.5% on-schedule delivery, measured monthly and reported to you.
Breakage response Source layout changes triaged same business day; critical sources inside 4 hours.
Data quality Schema validation on every run plus sampled human QA before any delivery leaves us.
Escalation A named engineer and an account owner, not a shared ticket queue.
Change requests Field additions and source changes handled inside the retainer, not re-quoted.
Exit Your historical data exported in full on request. No lock-in, no export fee.

Why teams pick Actowiz for this work

  • Engineers, not a dashboard. You get people who fix breakages, not a self-serve tool you maintain yourself.
  • We tell you what we can't do. Scope limits and coverage gaps are stated before you sign, not discovered in month three.
  • QA is part of the service. Schema validation and sampled human review run before delivery, every run.
  • Compliance is documented. Sources, method and lawful basis written down so your legal team can review them.
  • Fixed monthly cost. No per-request metering, no surprise overage on a month when a competitor adds SKUs.
  • Six years, 40+ countries. Long-running production pipelines across retail, travel, mobility and finance.
Definitions

Terms used on this page

Plain definitions of the terms used on this page, so procurement and legal reviewers are working from the same vocabulary as your data team.

FAQ

Pincode coverage: frequently asked questions

Starting with the request that arrives most often.

Yes, and we usually recommend against it. Pincodes within the same catchment type behave similarly, so an exhaustive sweep captures the variation plus a great deal of redundancy at several times the cost.

A metro with 300 pincodes, 2,000 SKUs and two daily observations is 1.2 million observations a day before a second platform. A stratified panel is roughly a seventh of that and moves the same way.

When you need a claim about every pincode rather than about the market — coverage obligations, regulatory work, or a distribution audit where a specific pincode matters in its own right.

We will build it. We would just rather you chose it deliberately than by default.

Because a comparison between two platforms on two different pincode sets is not a comparison. A price difference could be the platforms or the geography, and nothing in the data says which.

One panel and one schedule across all five makes the records comparable by construction.

Additions are logged with the date they entered, and existing points are never removed silently. panel_version and panel_entered_at travel with every record.

That matters because a panel that grew mid-series looks like a market that grew. With the fields, you can filter to points present throughout a period.

No. A pincode is a geographic identifier covering a delivery area, not an individual or their address. We collect no personal data in any market.

A panel identifies where a platform delivers, not who lives there.

Designed separately, not as additional metro points. Tier-two markets have thinner platform coverage, different catchment structure and different assortment logic.

Treating them as more of the same produces a panel that is over-weighted to metro behaviour and describes tier-two badly.

We quote individually, and pincode count is the dominant lever — more than SKU count, which is what people usually focus on.

One scoping call, a written panel proposal stating what it represents, a free pilot within 24 hours, then a fixed monthly quote. Request a panel proposal.

Get a panel proposal before a quote

Tell us the cities and the catchment types that matter. We return a written proposal stating what the panel represents and what it does not.

If your question genuinely needs every pincode, we will say so and quote for that instead.
Social Proof That Converts

Trusted by Global Leaders Across Q-Commerce, Travel, Retail, and FoodTech

Our web scraping expertise is relied on by 4,000+ global enterprises including Zomato, Tata Consumer, Subway, and Expedia — helping them turn web data into growth.

4,000+ Enterprises Worldwide
50+ Countries Served
20+ Industries
Join 4,000+ companies growing with Actowiz →
Real Results from Real Clients

Hear It Directly from Our Clients

Watch how businesses like yours are using Actowiz data to drive growth.

1 min
★★★★★
"Actowiz Solutions offered exceptional support with transparency and guidance throughout. Anna and Saga made the process easy for a non-technical user like me. Great service, fair pricing!"
TG
Thomas Galido
Co-Founder / Head of Product at Upright Data Inc.
2 min
★★★★★
"Actowiz delivered impeccable results for our company. Their team ensured data accuracy and on-time delivery. The competitive intelligence completely transformed our pricing strategy."
II
Iulen Ibanez
CEO / Datacy.es
1:30
★★★★★
"What impressed me most was the speed — we went from requirement to production data in under 48 hours. The API integration was seamless and the support team is always responsive."
FC
Febbin Chacko
-Fin, Small Business Owner
icons 4.8/5 Average Rating
icons 50+ Video Testimonials
icons 92% Client Retention
icons 50+ Countries Served

Join 4,000+ Companies Growing with Actowiz

From Zomato to Expedia — see why global leaders trust us with their data.

Why Global Leaders Trust Actowiz

Backed by automation, data volume, and enterprise-grade scale — we help businesses from startups to Fortune 500s extract competitive insights across the USA, UK, UAE, and beyond.

icons
7+
Years of Experience
Proven track record delivering enterprise-grade web scraping and data intelligence solutions.
icons
4,000+
Projects Delivered
Serving startups to Fortune 500 companies across 50+ countries worldwide.
icons
200+
In-House Experts
Dedicated engineers across scrapers, AI/ML models, APIs, and data quality assurance.
icons
9.2M
Automated Workflows
Running weekly across eCommerce, Quick Commerce, Travel, Real Estate, and Food industries.
icons
270+ TB
Data Transferred
Real-time and batch data scraping at massive scale, across industries globally.
icons
380M+
Pages Crawled Weekly
Scaled infrastructure for comprehensive global data coverage with 99% accuracy.

AI Solutions Engineered
for Your Needs

LLM-Powered Attribute Extraction: High-precision product matching using large language models for accurate data classification.
Advanced Computer Vision: Fine-grained object detection for precise product classification using text and image embeddings.
GPT-Based Analytics Layer: Natural language query-based reporting and visualization for business intelligence.
Human-in-the-Loop AI: Continuous feedback loop to improve AI model accuracy over time.
icons Product Matching icons Attribute Tagging icons Content Optimization icons Sentiment Analysis icons Prompt-Based Reporting

Connect the Dots Across
Your Retail Ecosystem

We partner with agencies, system integrators, and technology platforms to deliver end-to-end solutions across the retail and digital shelf ecosystem.

icons
Analytics Services
icons
Ad Tech
icons
Price Optimization
icons
Business Consulting
icons
System Integration
icons
Market Research
Become a Partner →

Popular Datasets — Ready to Download

Browse All Datasets →
icons
Amazon
eCommerce
Free 100 rows
icons
Zillow
Real Estate
Free 100 rows
icons
DoorDash
Food Delivery
Free 100 rows
icons
Walmart
Retail
Free 100 rows
icons
Booking.com
Travel
Free 100 rows
icons
Indeed
Jobs
Free 100 rows

Latest Insights & Resources

View All Resources →
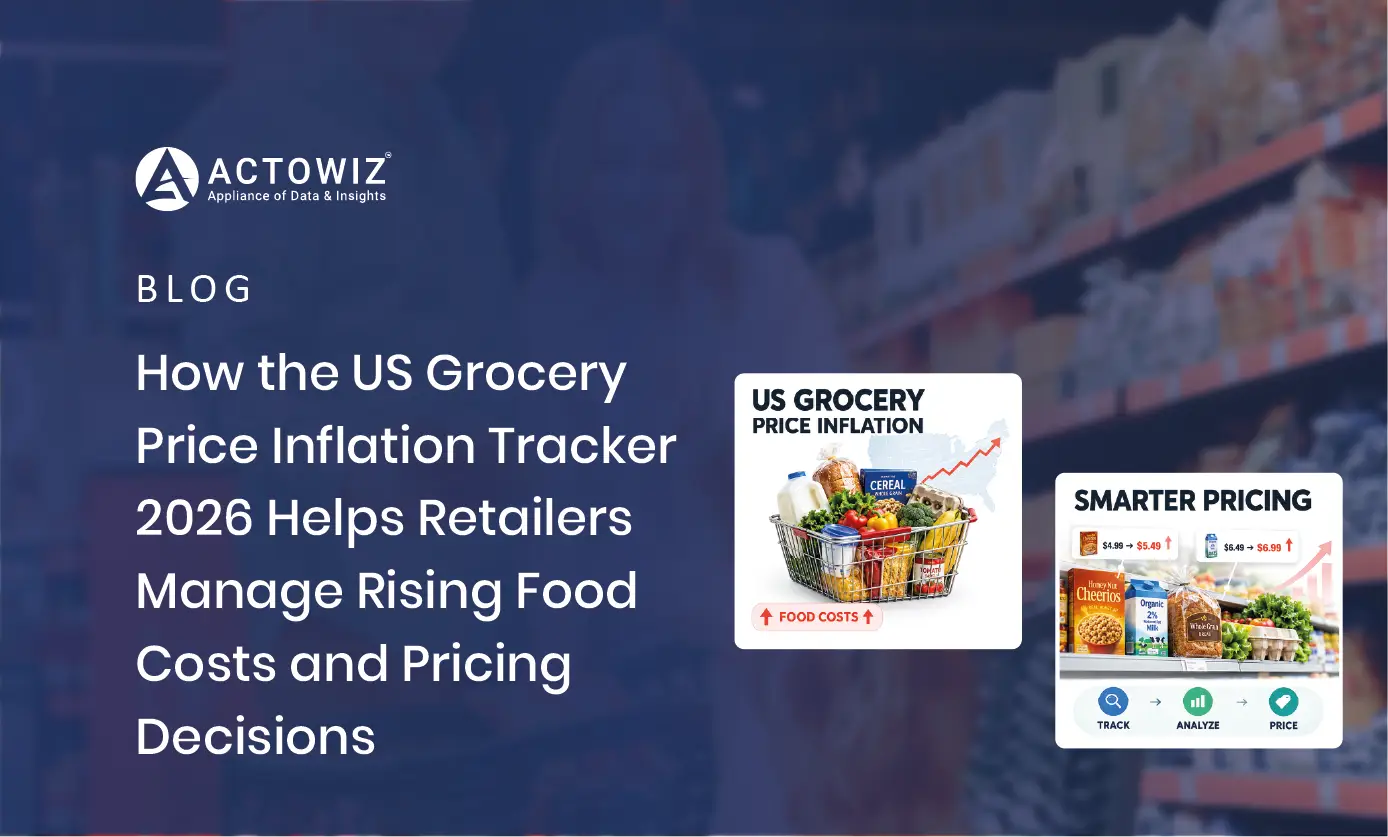
thumb
Blog

How the US Grocery Price Inflation Tracker 2026 Helps Retailers Manage Rising Food Costs and Pricing Decisions

Track the US Grocery Price Inflation Tracker 2026 to monitor food price trends, category changes, and inflation insights for smarter decisions.

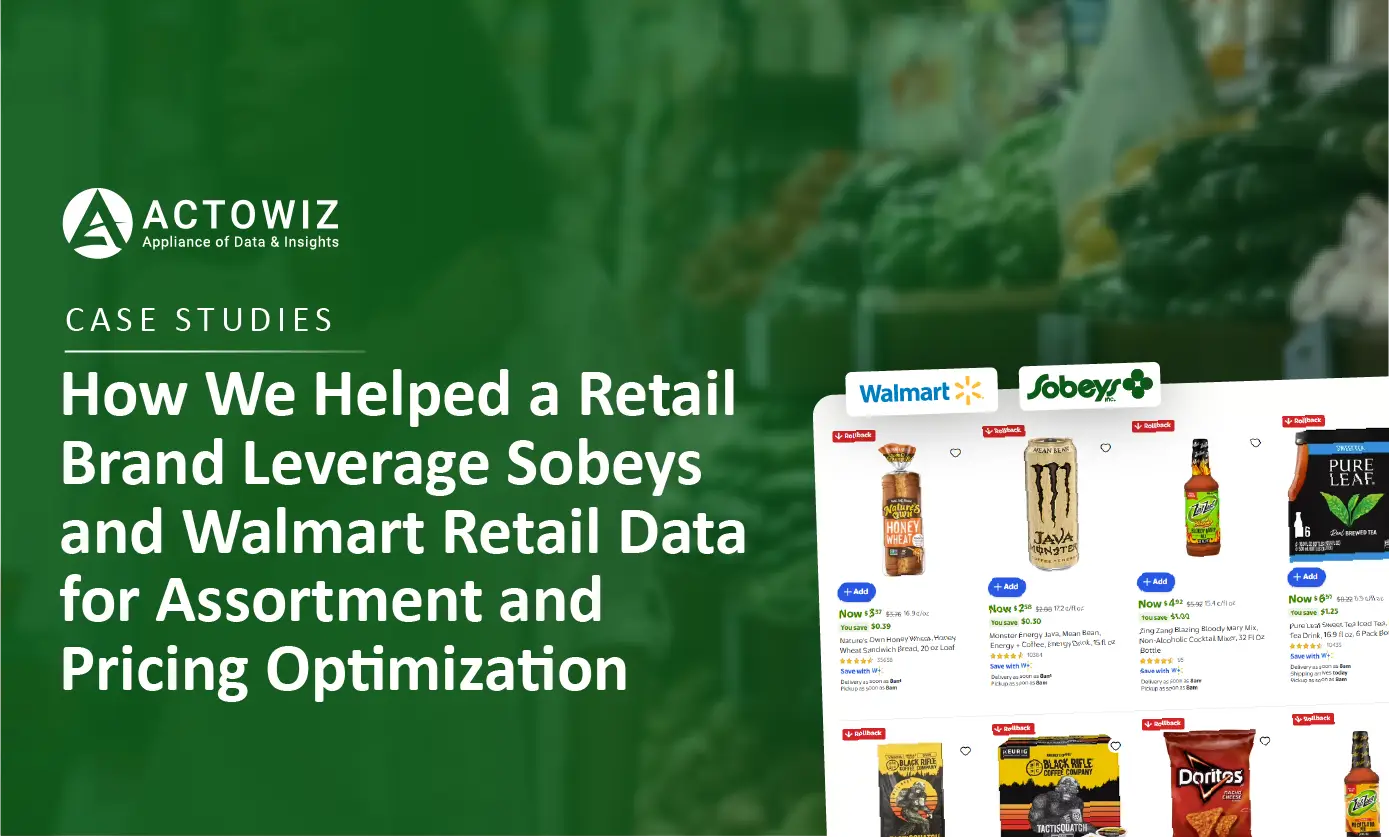
thumb
Case Study

How We Helped a Retail Brand Leverage Sobeys and Walmart Retail Data for Assortment and Pricing Optimization

Discover how Sobeys and Walmart retail data scraping helps brands track prices, products, promotions, and assortment for smarter retail decisions.

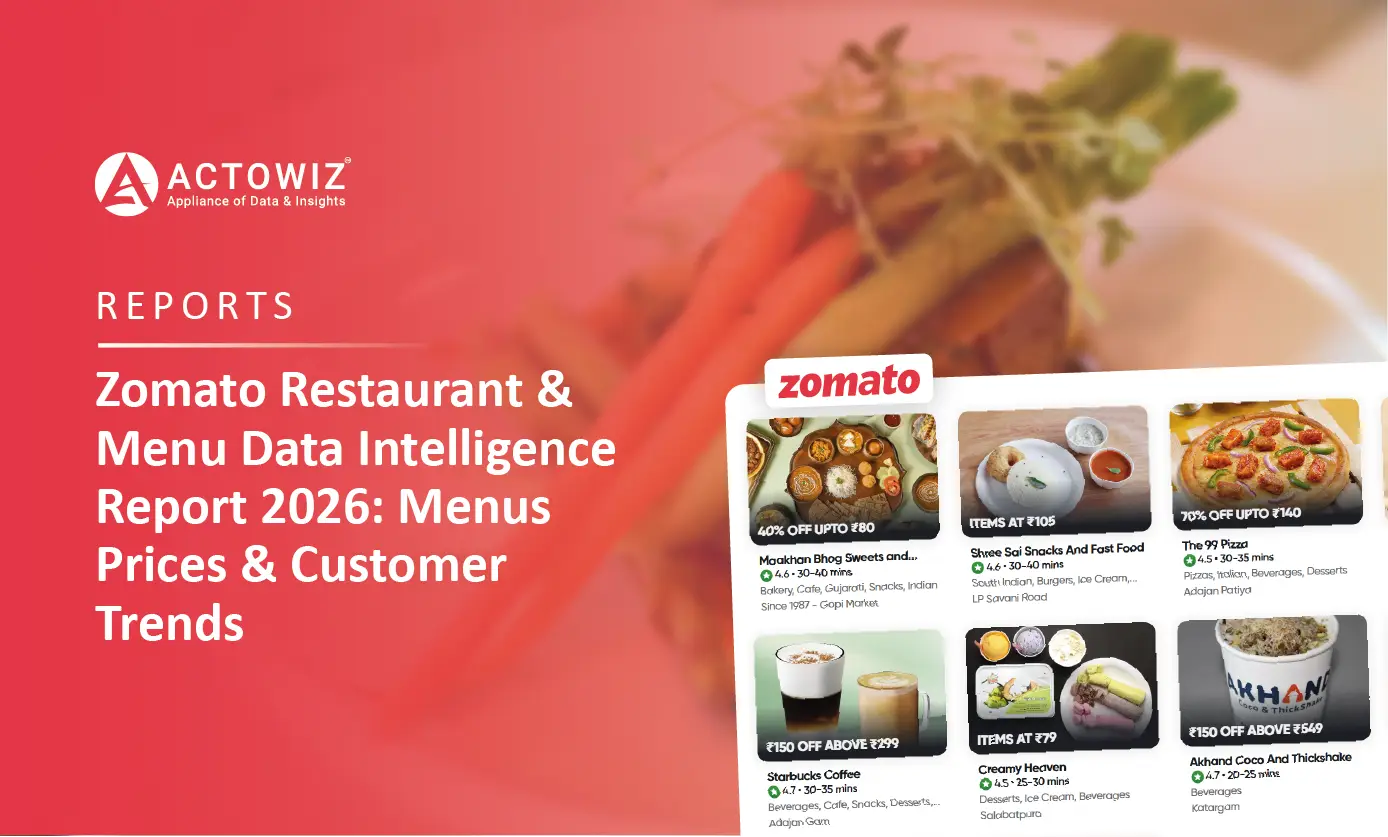
thumb
Report

Zomato Restaurant & Menu Data Intelligence Report 2026

Zomato Restaurant & Menu Data Intelligence Report 2026 reveals restaurant, menu, pricing, ratings, and food delivery trends for smarter decisions.

Start Where It Makes Sense for You

Whether you're a startup or a Fortune 500 — we have the right plan for your data needs.

icons
Enterprise
Book a Strategy Call
Custom solutions, dedicated support, volume pricing for large-scale needs.
icons
Growing Brand
Get Free Sample Data
Try before you buy — 500 rows of real data, delivered in 2 hours. No strings.
icons
Just Exploring
View Plans & Pricing
Transparent plans from $500/mo. Find the right fit for your budget and scale.
Get in Touch
Let's Talk About
Your Data Needs
Tell us what data you need — we'll scope it for free and share a sample within hours.
  • icons
    Free Sample in 2 HoursShare your requirement, get 500 rows of real data — no commitment.
  • icons
    Plans from $500/monthFlexible pricing for startups, growing brands, and enterprises.
  • icons
    US-Based SupportOffices in New York & California. Aligned with your timezone.
  • icons
    ISO 9001 & 27001 CertifiedEnterprise-grade security and quality standards.
Request Free Sample Data
Fill the form below — our team will reach out within 2 hours.
+1
Free 500-row sample · No credit card · Response within 2 hours

Request Free Sample Data

Our team will reach out within 2 hours with 500 rows of real data — no credit card required.

+1
Free 500-row sample · No credit card · Response within 2 hours