Introduction
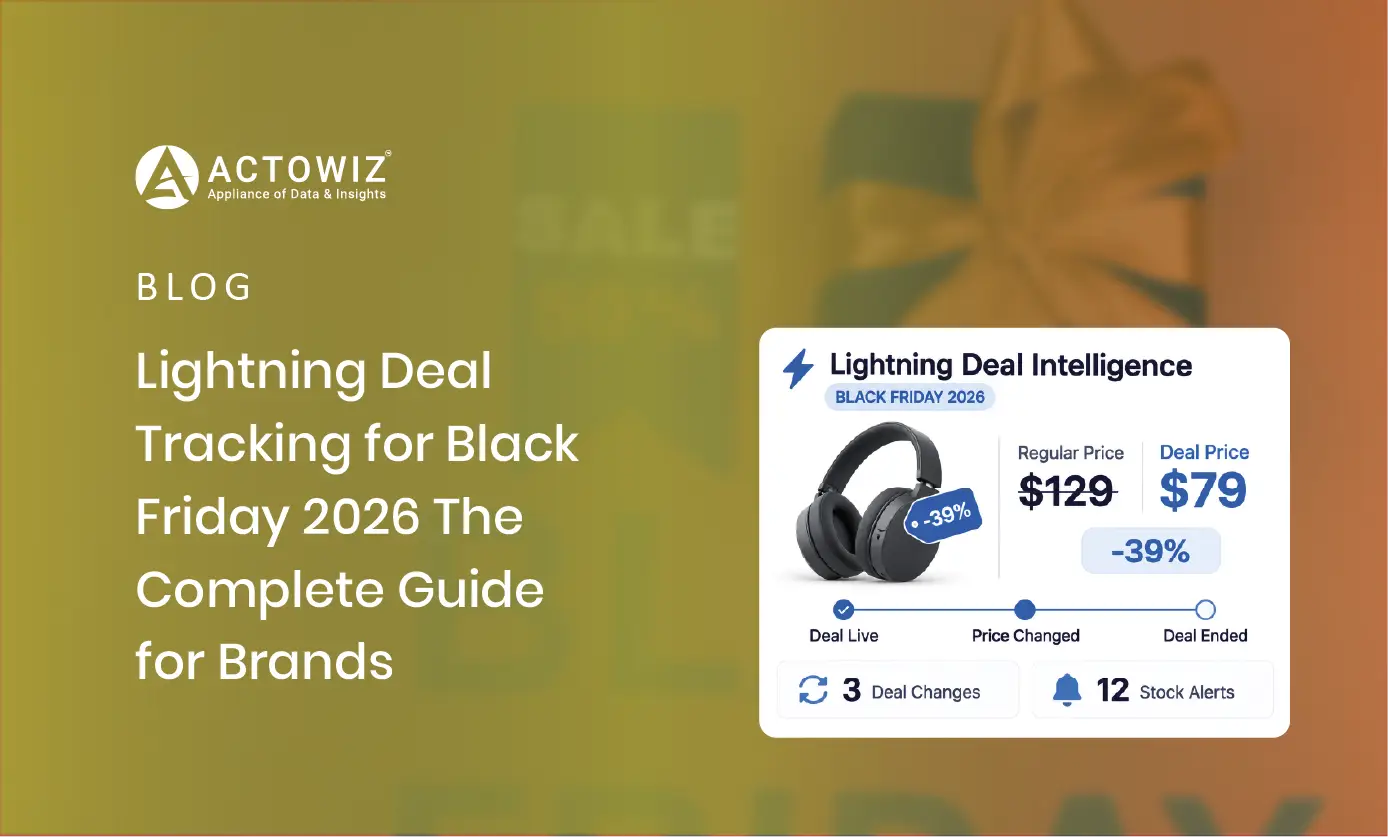
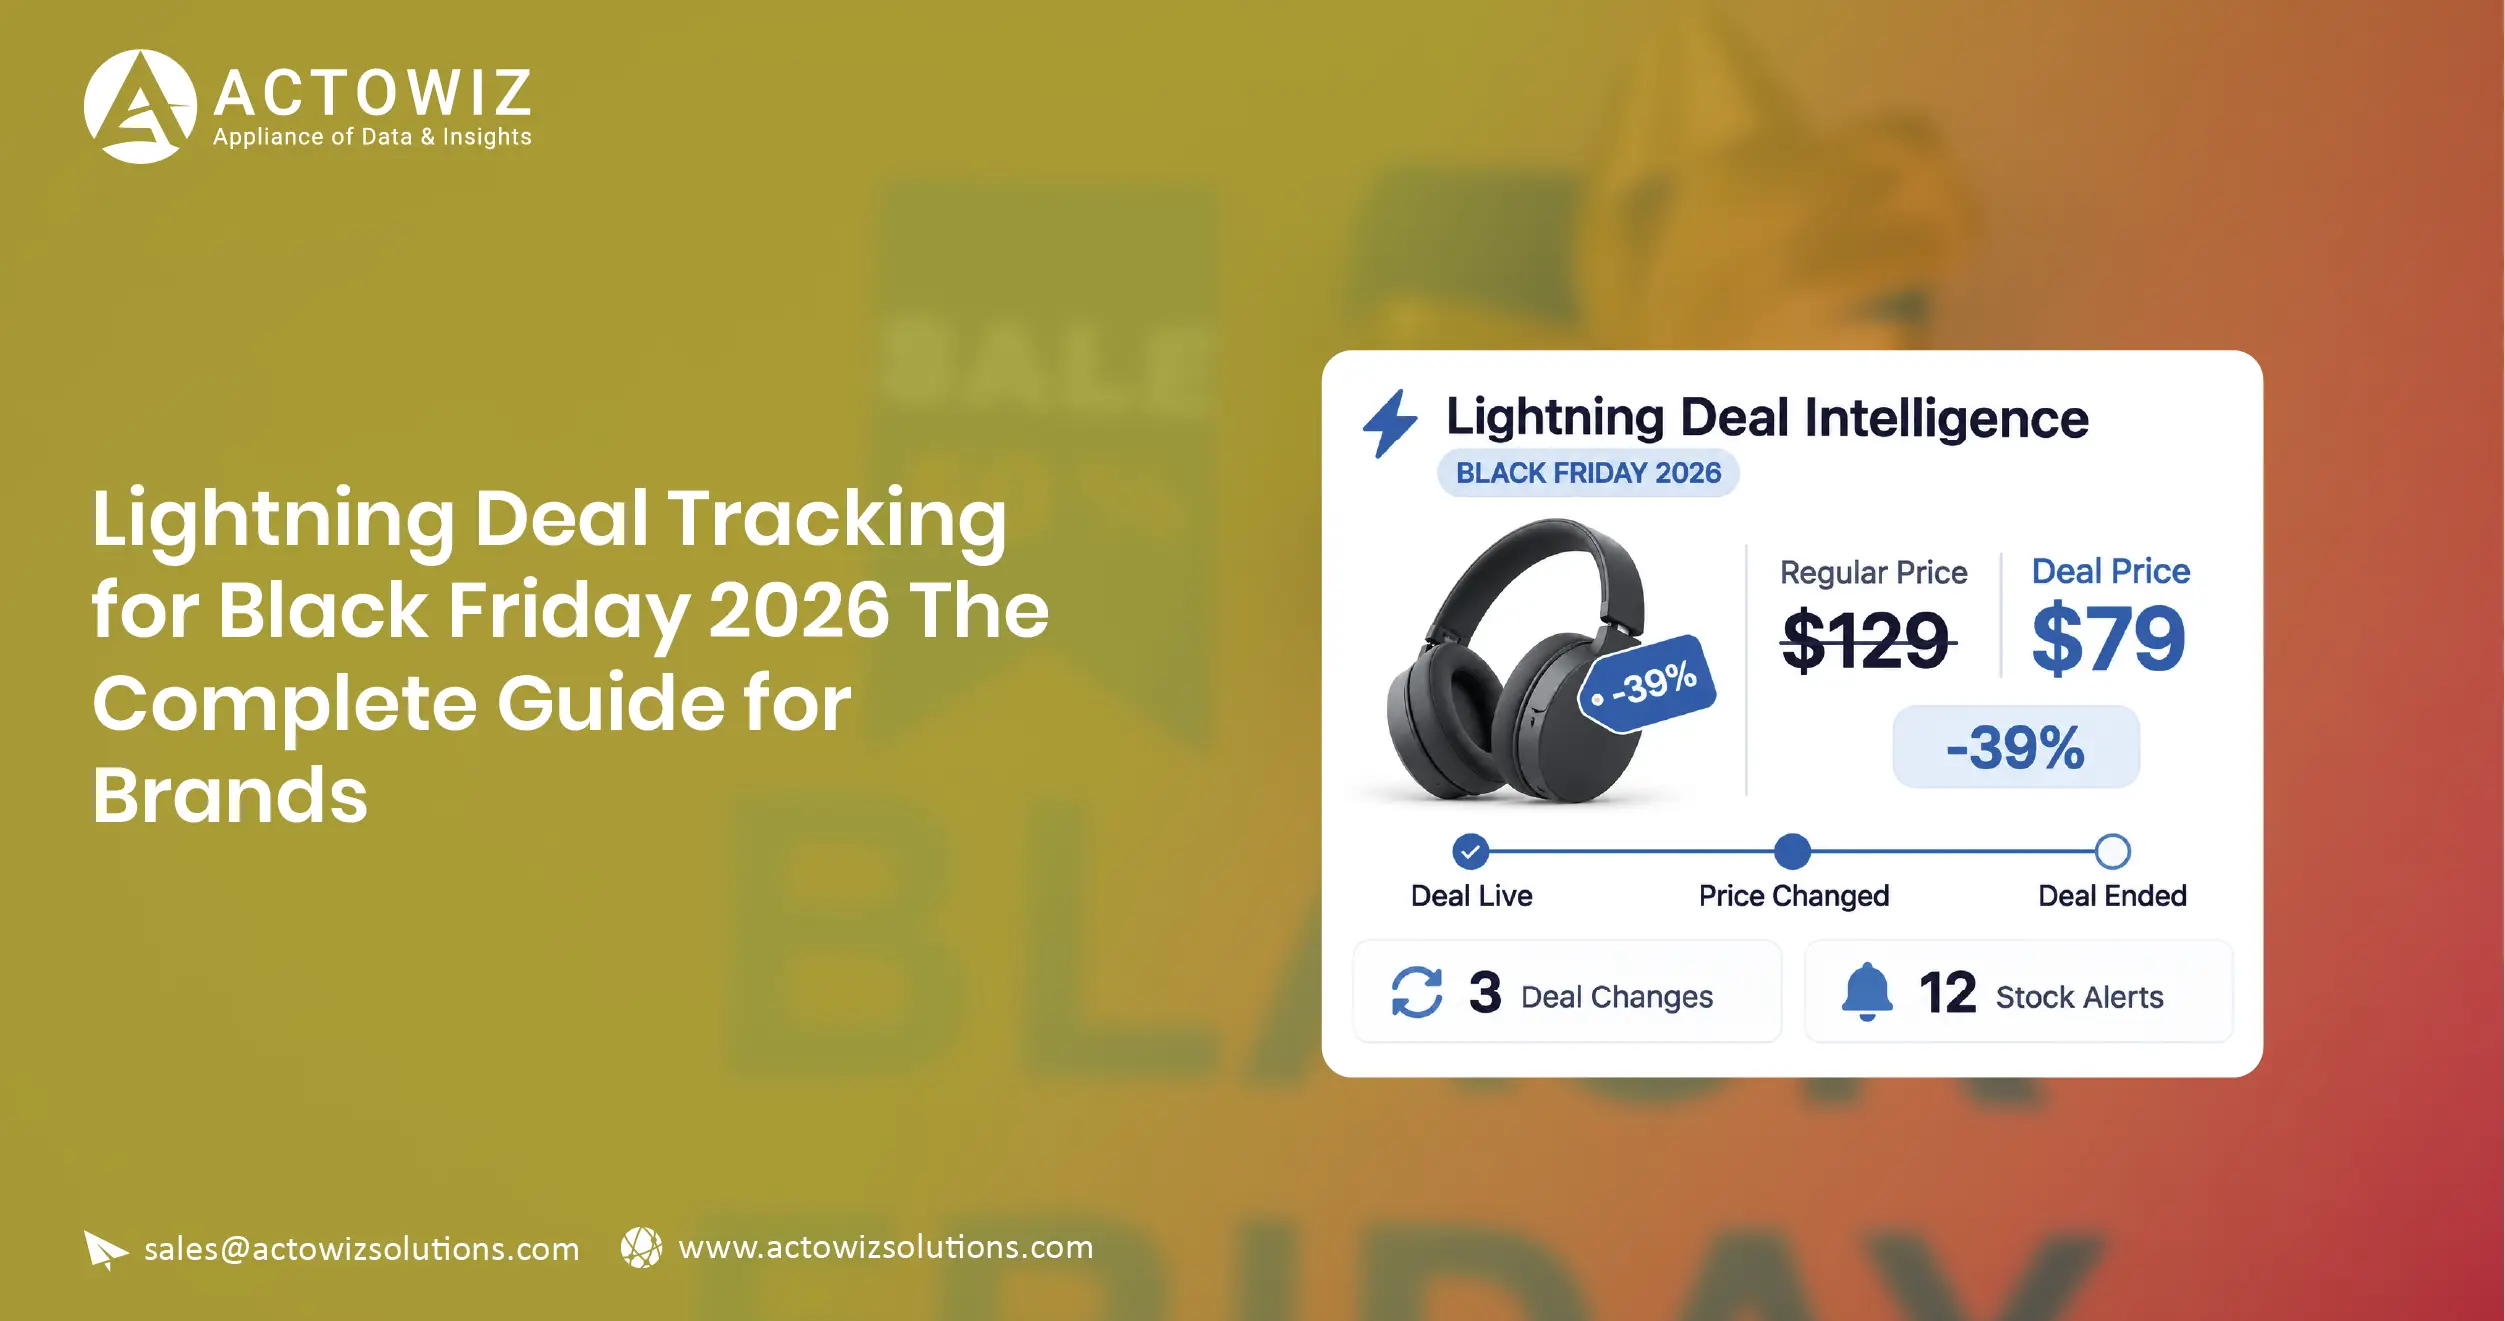
Lightning deal tracking means capturing short, time-limited offers on Amazon, Walmart, Target and Best Buy as they happen: the SKU, deal price, normal price, start and end time, and how fast stock is claimed. Brands use the data to check promotion execution, protect price parity and see where competitors are buying share during Black Friday 2026.
A normal daily price check misses most of this. A lightning deal can start at 10:00, be 80% claimed by 10:40 and be gone by 11:00. If your tracker runs once a day, the deal never appears in your data, even though thousands of shoppers saw it and a rival may have matched it.
The window this year is long. Amazon UK's Black Friday Week runs from 19 to 30 November 2026, with early offers released on 10, 13 and 16 November (Which?, 16 November 2026). Walmart has three US events: early deals on 12–15 November, the core Black Friday event on 23–29 November and Cyber Monday deals from 30 November to 2 December (Retail Dive, 26 October 2026). That is close to three weeks of short, stacked deal drops.
What counts as a lightning deal
"Lightning Deal" is Amazon's name for a deal that runs for a few hours, has a limited number of units and shows a "percent claimed" bar. Other retailers use different names for similar time-boxed offers, such as flash deals, deals of the day or member-only early access. For tracking, treat them as one family: an offer with a clear start, a clear end and a limited quantity or time.
The table below compares how these offers usually appear. Formats change each season, so confirm labels on the live pages before you build rules.
| Retailer |
Typical time-limited formats |
What is usually visible on the page |
Tracking note |
| Amazon (US and UK) |
Lightning Deals, daily deal drops during Black Friday Week, Prime-exclusive deals |
Deal price, list or "was" price, timer, percent claimed |
Capture the claim bar often; it shows sell-through speed |
| Walmart (US) |
Event deals, flash deals, member early access |
Price, "was" price, deal badge, stock status |
Walmart+ early access can make the price differ by viewer state |
| Target (US) |
Daily deals, Target Circle offers |
Sale price, regular price, offer text |
Separate loyalty offers from open prices |
| Best Buy (US) |
Deal of the Day, doorbuster-style deals, member offers |
Sale price, savings amount, availability |
Store pickup availability can differ by ZIP |
Why lightning deal data matters to brands
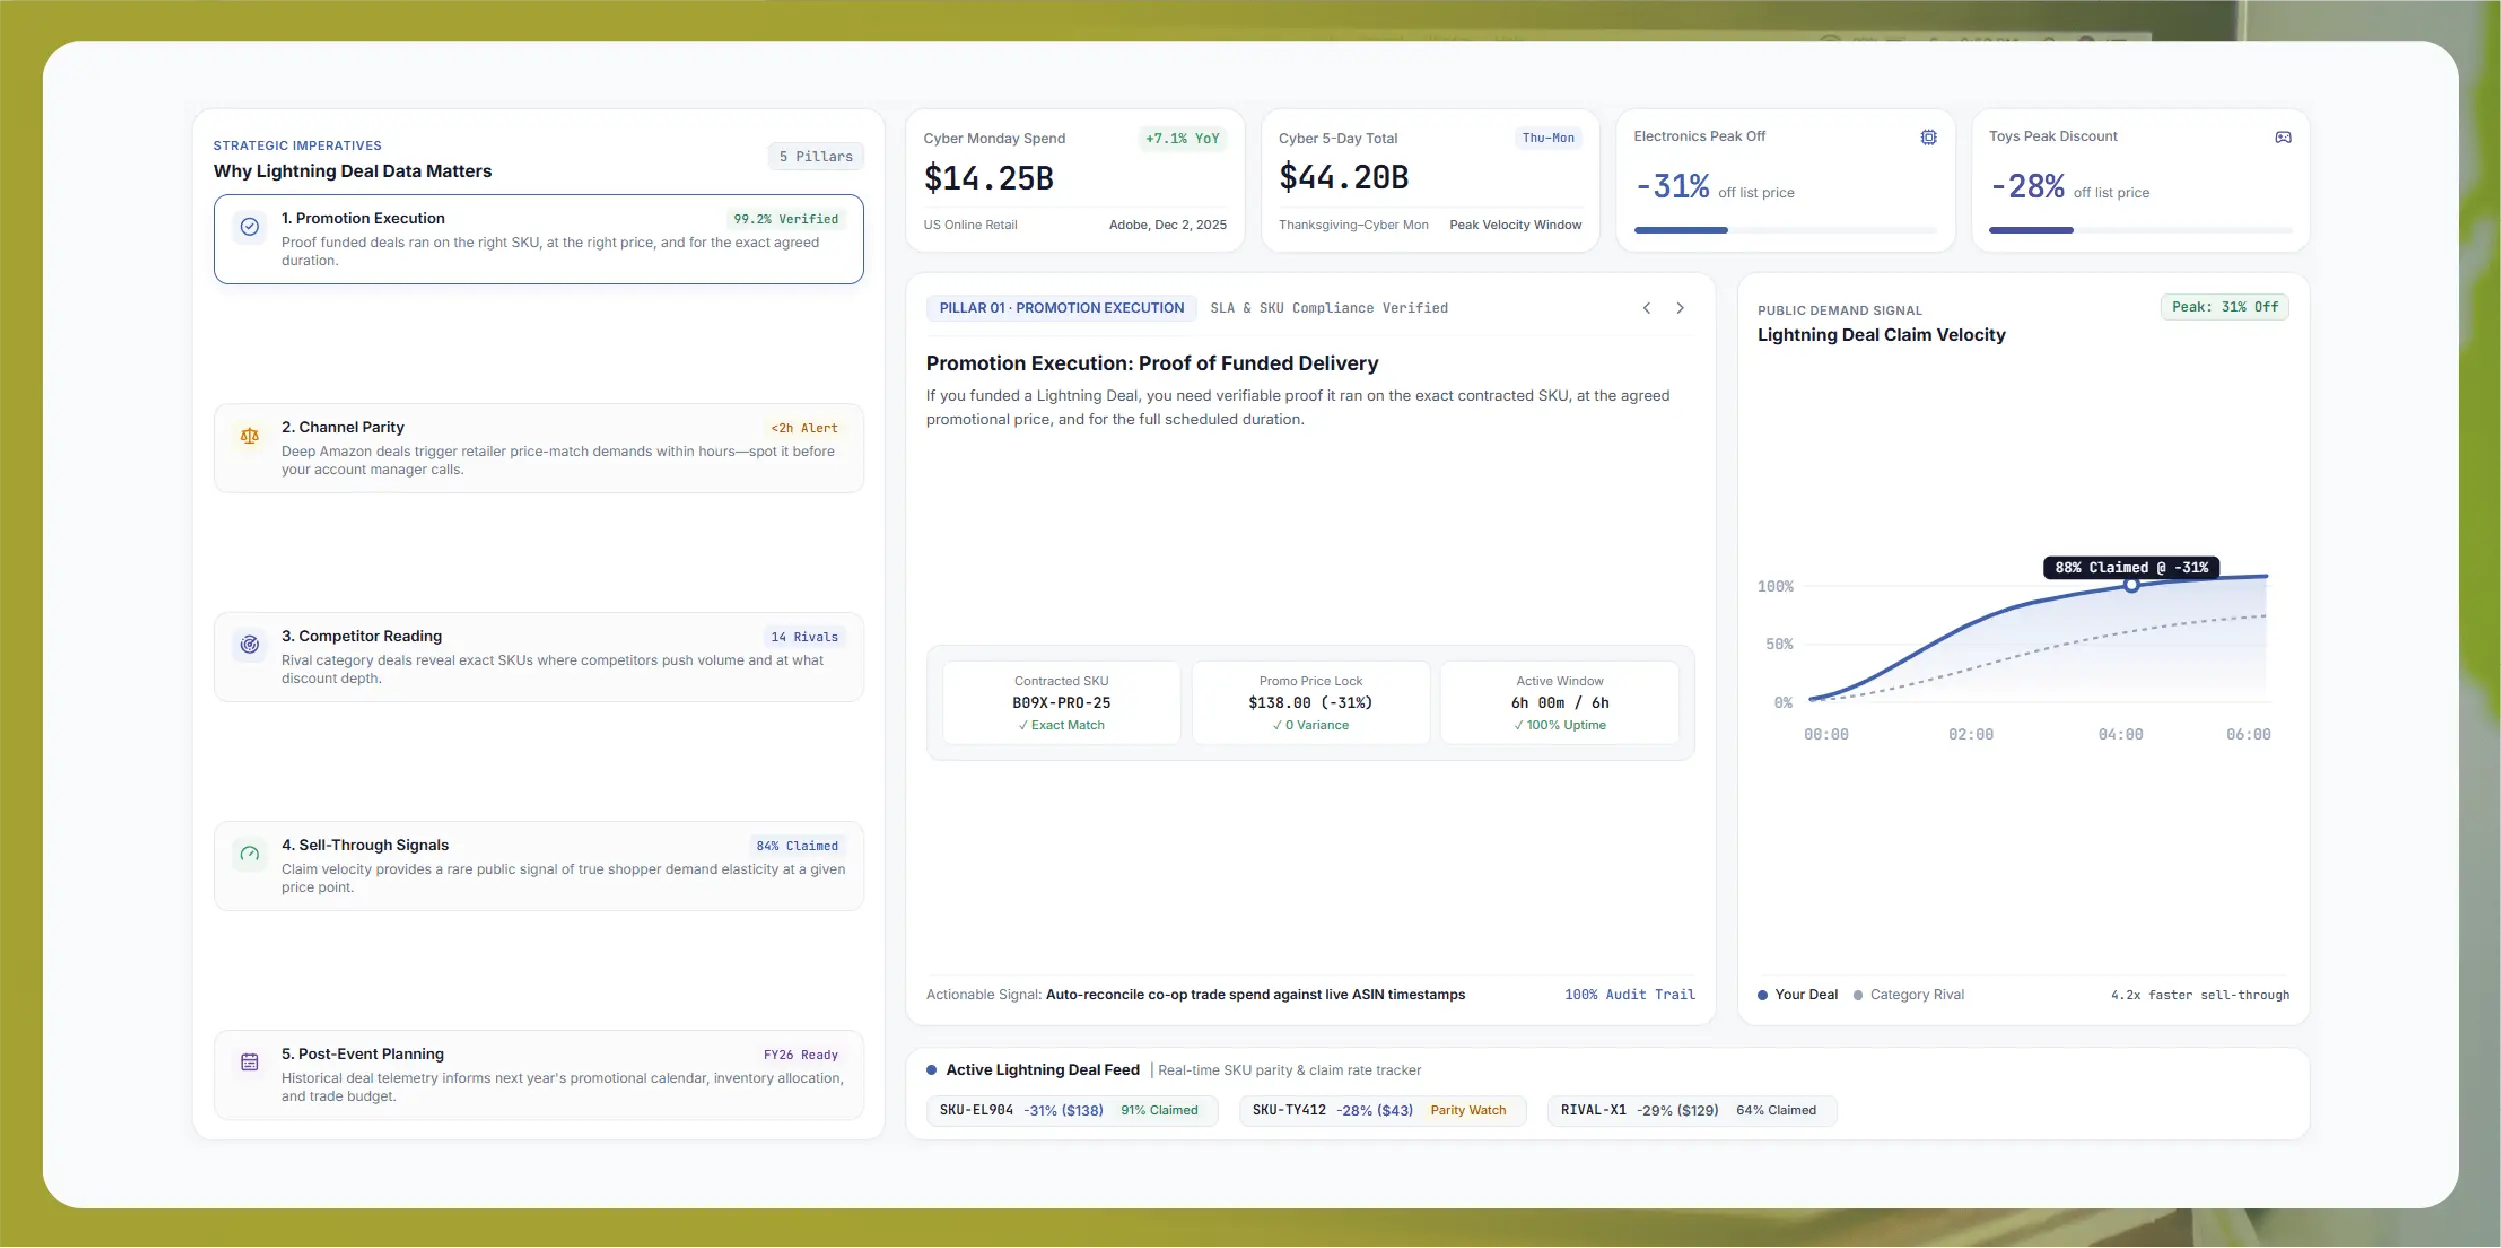
- Promotion execution. If you funded a deal, you need proof it ran on the right SKU, at the right price and for the agreed time.
- Channel parity. A deep Amazon lightning deal can trigger price-match requests from other retailers within hours. You want to see it before your account manager calls.
- Competitor reading. Rival deals in your category show where competitors are pushing volume and at what depth.
- Sell-through signals. The speed at which a deal is claimed is a rare public signal of demand at a given price.
- Post-event planning. Deal history helps you plan next year's calendar and budget.
The money at stake is large. Adobe reported that US shoppers spent $14.25 billion online on Cyber Monday 2025, up 7.1% year on year, and $44.2 billion across the five days from Thanksgiving to Cyber Monday (Adobe, 2 December 2025). Adobe also reported peak Cyber Monday discounts of 31% in electronics and 28% in toys, off listed prices. Lightning deals are one of the main ways those discounts reach shoppers.
The 12 fields every lightning deal feed should include
- retailer and country – for example Amazon.co.uk, Amazon.com, Walmart.com
- product ID – ASIN, Walmart item ID, Target TCIN or Best Buy SKU, plus brand and title
- deal_type – lightning deal, deal of the day, event deal, member-only
- deal_price – the price shown during the deal
- reference_price – the "was", list or typical price the retailer shows
- discount_pct – calculated from the two prices, not copied from a badge
- deal_start_seen and deal_end_seen – first and last time the deal was captured
- timer_value – the countdown shown on the page, if any
- percent_claimed – Amazon's claim bar, captured at each check
- availability – in stock, sold out, waitlist, limited
- seller and fulfilment – first party or marketplace seller, shipped or pickup
- capture_time and screenshot reference – your evidence for every row
Keep the raw label text as well. A badge reading "Limited time deal" and one reading "Lightning Deal" may look the same in a price chart but mean different things.
How to set up lightning deal tracking
Step 1 – Build the watch list. Start with your own SKUs, then add the top 20–50 competitor SKUs in each category, and the first page of results for your main keywords. Deals often appear on items you did not expect.
Step 2 – Add deal pages. Each retailer has a deals hub. Track those pages as well as product pages, so new deals are found as soon as they go live.
Step 3 – Set the cadence by priority. Outside events, daily checks are fine. During Black Friday Week, check priority SKUs every 15–30 minutes and the deals hubs at least hourly. This is how you catch start times and sell-outs.
Step 4 – Store every capture. Do not overwrite prices. Keep a row per check, so you can rebuild the full timeline of each deal.
Step 5 – Build deal episodes. Group captures into one "deal episode" per SKU: first seen, last seen, lowest price, highest percent claimed.
Step 6 – Alert the right people. Send alerts for new competitor deals, your own deals going live or failing to start, and price gaps between retailers.
Step 7 – Review after the event. Compare planned deals with what actually ran, and note which competitor deals sold out fastest.
Cleaning and matching the data
Deal data is messy. The same product can carry different titles and IDs at each retailer. Match products with UPC or EAN where shown, then model number, then brand plus key attributes such as size or capacity. Flag uncertain matches for review rather than forcing them.
Watch for three common data issues. First, reference prices differ by retailer, so a "50% off" badge may be measured against a high list price. Calculate discount from the reference price and also from your own baseline price. Second, timers can reset when a deal is extended. Use first-seen and last-seen times, not only the timer. Third, sold-out deals often vanish from deals pages. Keep checking the product page so you can record the sell-out time.
Reading the data: what patterns mean
| Pattern |
Likely meaning |
Brand action |
| Competitor lightning deal hits 100% claimed in under an hour |
Strong demand at that price point |
Review your own deal depth for the next drop |
| Your funded deal does not appear at the planned time |
Set-up or eligibility issue |
Raise with your account team the same day |
| Amazon deal price below Walmart or Best Buy shelf price |
Price-match risk |
Prepare parity response before requests arrive |
| Same deal repeats every day of the event |
Retailer pushing volume on that SKU |
Check stock cover and forecast |
| Marketplace seller undercuts during the deal |
Seller reacting to the deal price |
Separate seller pricing from first-party price |
| Price stays low after the deal ends |
New baseline, not a deal |
Update your price ladder and margin view |
Use cases
- Deal compliance – confirm that agreed lightning deals ran with the right price, time and quantity.
- Cross-retailer parity – compare Amazon, Walmart, Target and Best Buy prices for the same SKU every few minutes during peak hours.
- Competitive share of deals – count how many deals each brand ran in your category, and at what depth.
- Demand sensing – use percent-claimed speed as a signal for which price points move volume.
- Next-year planning – build a deal calendar from this year's history; history builds from the start of collection.
Common mistakes in Black Friday deal tracking
- Checking once a day. Most short deals start and end between checks.
- Trusting the badge. Calculate discount yourself; reference prices vary.
- Ignoring the UK. Amazon UK runs its own event calendar, with early offers starting on different days.
- Mixing member and open prices. Prime, Walmart+ and loyalty prices need their own fields.
- No evidence. Without time-stamped screenshots, deal disputes become opinion against opinion.
- Stopping on Cyber Monday. Walmart's Cyber Monday event alone runs to 2 December in 2026, and deals keep moving after that.
Legal and compliance basics
Track only public product and deals pages. Do not log in to member accounts, do not collect shopper data and respect each retailer's terms and robots rules. Keep request rates gentle, especially during peak hours when sites are busy. Member-only prices that require an account are out of scope unless the retailer shows them publicly. Treat findings as evidence for your commercial team, not as automatic breaches.
Build vs buy
A simple script can read one price. Tracking hundreds of SKUs across four retailers and two countries, every 15 minutes, with screenshots, deal episodes and alerts, is a different job, and it must work in the busiest two weeks of the year. Actowiz Solutions delivers lightning deal and Black Friday price data as CSV, JSON, dashboard or API, at the cadence you choose, with time-stamped evidence and alert rules set to your watch list.
Learn more about our Black Friday price tracking, Black Friday price monitoring checklist, Amazon Buy Box tracking, price monitoring frequency guide and Black Friday 2026 discounts report.
Frequently Asked Questions
What is lightning deal tracking?
It is the frequent capture of short, time-limited deals, with price, reference price, start and end time and percent claimed, so brands can see what ran and how fast it sold.
How often should lightning deals be checked?
Every 15–30 minutes for priority SKUs during Black Friday Week, and at least hourly for retailer deals pages. Daily is enough outside events.
Can you track the percent claimed bar on Amazon?
Yes, where it is shown publicly on the deal or product page. We capture it at each check to estimate sell-through speed.
Can you track UK and US deals together?
Yes. Amazon.co.uk and Amazon.com run different calendars, so we track them as separate markets and report them side by side.
Do you have past years' lightning deal data?
History builds from the start of collection. If you start now, you will have a full Black Friday 2026 record to plan next year.
 Actowiz Solutions

 By industry
 Pricing & Promotions
 Brand & Intelligence
 Digital Shelf & Search
 Assortment
 For Retailers
 E-Commerce Dashboard
 Flipkart Insights (Live)
 Grocery Intelligence
.svg) Grocery Price (U.S.)
.svg) Quick Commerce (India)
 Food & Restaurant
 Fashion Intelligence
 Automotive
 Travel & Hospitality
 Real Estate
 Food Delivery Intelligence
 OTT & Streaming
 Fuel & EV Charging Price Tracker
 By Use Case
 Pricing Intelligence
 Digital Shelf Analytics
 MAP Monitoring
 Cross-Border Price Parity
 Share of Search
 Review Sentiment
 Kitchen Market Gaps
 Dynamic Pricing / AI Repricing
 Promotions & Deals Alerts
 B2B / POI & Lead Data
 AI Search Visibility Dashboard
 Baby Products on Quick Commerce
 Hotel & Flight Rate Parity
 By Region
 Flipkart Real-Time Insights
 Quick Commerce — Zepto · Blinkit
 Pincode Price Tracker
 GCC Q-Commerce — Talabat · Noon
 UK Grocery — Tesco, Sainsbury's, Asda
 AU Grocery — Coles & Woolworths
 Marketplace Scrapers
 Developer APIs
 Universal APIs
 Delivery & SDKs
 Knowledge Center
 Guides & Playbooks
 Downloads & Tools
 Trust & Company


 4.8/5 Average Rating
 50+ Video Testimonials
 92% Client Retention
 50+ Countries Served